问题说明(apache可以,nginx依旧不行):
vscode调试单个文件正常,就是无法远程调试(比如通过浏览器运行时调试),折腾了一整天,最后发现是php.ini 中少了两项配置所导致:
- xdebug.remote_enable=1
这个开关控制Xdebug是否应该尝试联系一个正在监听主机和端口的调试客户端,这些主机和端口是用xdebug.remote_host和xdebug.remote_port设置的。如果不能建立连接,脚本将继续进行,就像这个设置为0一样。
- xdebug.remote_autostart=1
通常,您需要使用特定的 HTTP GET/POST 变量来启动远程调试,当此设置设置为 1 时,Xdebug 将始终尝试启动远程调试会话并尝试连接到客户端,即使 GET/POST/COOKIE 变量不存在。
vscode配置xdebug步骤
下载xdebug
- 查看PHP版本

- 查找对应的xdebug

- 放到php更目录下的ext目录下

- 或者通过phpstudy配置xdebug


注意:phpstudy配置完成后查看php.ini,查找xdebug.remote_autostart =1,如果没有,就在xdebug模块追加,修改xdebug.remote_enable 等于 1 或者 On,修改debug.trace_output_dir和xdebug.profiler_output_dir的路径
配置php.ini
- 配置php.ini文件
[XDebug]
	zend_extension=E:/phpstudy_pro/Extensions/php/php7.4.3nts/ext/php_xdebug.dll    ;xdebug的路径
	xdebug.collect_params=1
	xdebug.collect_return=1 ;此设置默认为 0,控制 Xdebug 是否应将函数调用的返回值写入跟踪文件。
	xdebug.auto_trace=On ;当这个设置为开时,函数调用的追踪将在脚本运行之前被启用
	xdebug.trace_output_dir=E:/phpstudy_pro/Extensions/php/log/php/trace
	xdebug.profiler_enable=On
	xdebug.profiler_output_dir=E:/phpstudy_pro/Extensions/php/log/profiler
	;远程调试配置
	xdebug.remote_enable=1  ;开启远程调试功能
	xdebug.remote_host=localhost
	xdebug.remote_port=9001  ;默认端口9000  和 php冲突
	xdebug.remote_handler=dbgp
	xdebug.remote_autostart =1
配置vscode
- vscode 下载PHP Debug,修改配置信息
{
    // 使用 IntelliSense 了解相关属性。
    // 悬停以查看现有属性的描述。
    // 欲了解更多信息,请访问: https://go.microsoft.com/fwlink/?linkid=830387
    // 修改端口号和php.ini里一直
    "version": "0.2.0",
    "configurations": [
        {
            "name": "Listen for Xdebug",
            "type": "php",
            "request": "launch",
            "port": 9001
        },
        {
            "name": "Launch currently open script",
            "type": "php",
            "request": "launch",
            "program": "${file}",
            "cwd": "${fileDirname}",
            "port": 0,
            "runtimeArgs": [
                "-dxdebug.start_with_request=yes"
            ],
            "env": {
                "XDEBUG_MODE": "debug,develop",
                "XDEBUG_CONFIG": "client_port=${port}"
            }
        },
        {
            "name": "Launch Built-in web server",
            "type": "php",
            "request": "launch",
            "runtimeArgs": [
                "-dxdebug.mode=debug",
                "-dxdebug.start_with_request=yes",
                "-S",
                "localhost:0"
            ],
            "program": "",
            "cwd": "${workspaceRoot}",
            "port": 9001,
            "serverReadyAction": {
                "pattern": "Development Server \\(http://localhost:([0-9]+)\\) started",
                "uriFormat": "http://localhost:%s",
                "action": "openExternally"
            }
        }
    ]
}
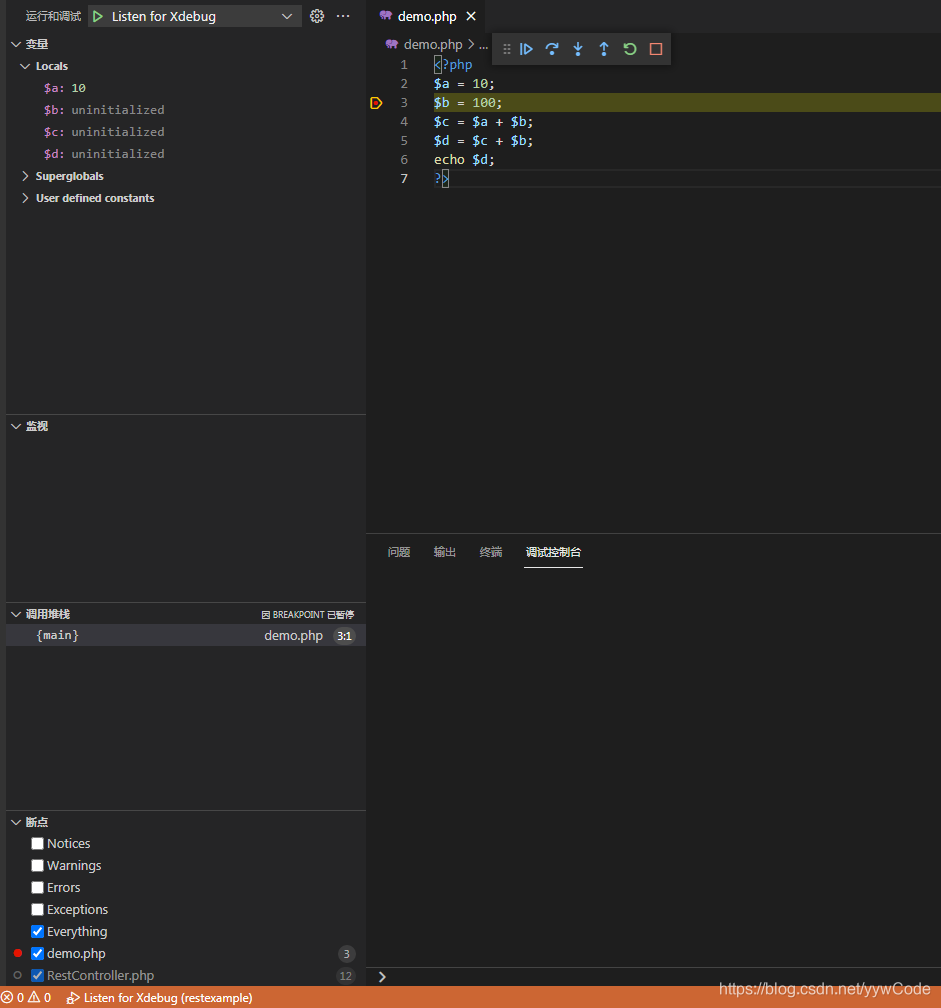
测试vscode调试(直接上图)
- 选择调试模式为Listen for Xdebug,打好断点

- 打开浏览器,进入编写好的程序
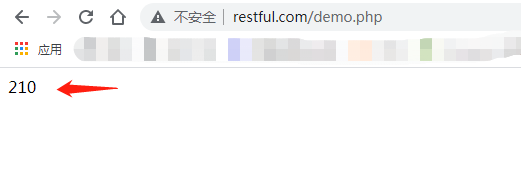
3.打开调试,然后刷新页面,就可以进入断点
倒腾了一整天,nginx使用xdebug可以连接,就是不能进入断点调试,下面是xdebug返回的日志信息,有知道问题所在的朋友也告诉我一下o,麻烦了。
[11592] Log opened at 2021-08-14 09:59:12
[11592] I: Connecting to configured address/port: 127.0.0.1:9001.
[11592] I: Connected to client. :-)
[11592] -> <init xmlns="urn:debugger_protocol_v1" xmlns:xdebug="https://xdebug.org/dbgp/xdebug" fileuri="file:///E:/phpstudy_pro/WWW/classOverNow/public/index.php" language="PHP" xdebug:language_version="7.4.0" protocol_version="1.0" appid="11592" idekey="Administrator"><engine version="2.9.4"><![CDATA[Xdebug]]></engine><author><![CDATA[Derick Rethans]]></author><url><![CDATA[https://xdebug.org]]></url><copyright><![CDATA[Copyright (c) 2002-2020 by Derick Rethans]]></copyright></init>

[11592] -> <response xmlns="urn:debugger_protocol_v1" xmlns:xdebug="https://xdebug.org/dbgp/xdebug" status="stopping" reason="ok"></response>

[11592] Log closed at 2021-08-14 09:59:16