windows下phpstudy配置xdebug2.7
1、保证dll文件存在
一般phpstudy中会有该模块

2、配置php.ini文件
2.1、配置如下,不要用9000端口因为会被占用。
2.2、xdebug.remote_enable、xdebug.remote_autostart要记得打开
2.3、下方的三个路径注意要写对,zend_extension为dll路径,其他两个应该是调试日志(看路径里面的文件输出内容像是调试日志)
[XDebug]
xdebug.auto_trace=on
xdebug.auto_profile = on
xdebug.profiler_enable_trigger = On
xdebug.profiler_output_dir="D:\development\phpstudy\Extensions\php\php7.3.4nts\out_put"
xdebug.trace_output_dir="D:\development\phpstudy\Extensions\php\php7.3.4nts\out_put"
xdebug.remote_enable=1
xdebug.remote_autostart = on
xdebug.idekey=PHPSTORM
xdebug.remote_handler = dbgp
;xdebug.remote_host = localhost
xdebug.remote_host = 127.0.0.1
xdebug.remote_port=9001
zend_extension="D:\development\phpstudy\Extensions\php\php7.3.4nts\ext\php_xdebug.dll"
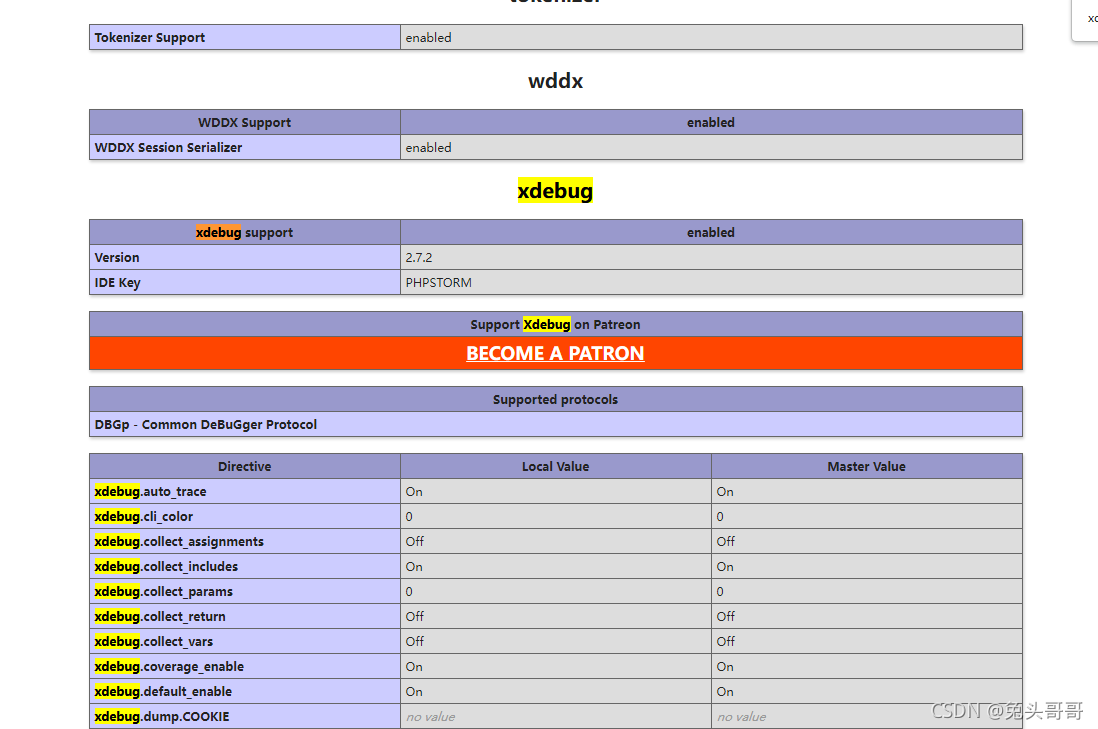
3、phpinfo()查看配置是否加载成功
4、配置phpstorm

将端口设置为php.ini中配置的端口即可

5、开始调试
5.1、打好断点以及开启调试监听

5.2、刷新页面

finish!