前言
使用 Prometheus监控 SpringBoot 应用,当应用很多,且上下线频繁时,需要不断的更改 Prometheus 的配置文件,不能灵活的使用,可以通过为 Prometheus配置注册中心,从注册中心拉取应用数据获取监控数据。
安装consul
这里使用docker安装,方便快捷。
docker-compose.yml文件
version: '3.1'
services:
  consul:
    image: consul:1.9.4
    container_name: "consul"
    restart: always
    privileged: true
    ports:
      - "8500:8500"
      - "8300:8300"
    volumes:
      - /consul/data:/consul/data
      - /consul/config:/consul/config
    command: [agent,-server,-ui,-client=0.0.0.0,-bootstrap-expect=1]
- consul配置文件
basic_config.json
cd /consul/config/
vim basic_config.json
{
  "datacenter": "east-aws",
  "data_dir": "/data/consul",
  "log_level": "INFO",
  "node_name": "batman",
  "server": true,
  "addresses": {
    "https": "0.0.0.0"
  },
  "telemetry": {
     "prometheus_retention_time": "744h",
     "disable_hostname": true
   }
}
这里有个坑,需要配置telemetry这个节点数据,否则,之后的实践会报错,如下:

配置prometheus
prometheus之前有文章已经讲过了,如何配置,这里只是简单介绍下需要改动的配置文件
- 修改
prometheus.yml
cd /usr/local/src/config


  - job_name: 'consul-prometheus'
    scrape_interval: 60s
    scrape_timeout: 10s
    scheme: http
    params:
      format: ['prometheus']
    consul_sd_configs:
      - server: '192.168.56.101:8500'
        services: []
其中 :
- consul_sd_configs指定 Consul 的地址
springboot 项目
添加监控
- 加入maven 监控相关坐标
		<dependency>
            <groupId>org.springframework.boot</groupId>
            <artifactId>spring-boot-starter-actuator</artifactId>
        </dependency>
        <dependency>
            <groupId>org.springframework.boot</groupId>
            <artifactId>spring-boot-starter-web</artifactId>
        </dependency>
        <dependency>
            <groupId>io.micrometer</groupId>
            <artifactId>micrometer-registry-prometheus</artifactId>
        </dependency>
        <dependency>
            <groupId>org.springframework.cloud</groupId>
            <artifactId>spring-cloud-starter-consul-discovery</artifactId>
        </dependency>
- 修改应用配置 applicaiton.properties
spring.application.name=fast-commmon-prometheus-example
# 打开所有 Actuator 服务
management.endpoints.web.exposure.include=*
# 将应用名称添加到计量器的 tag 中去
# 以便 Prometheus 根据应用名区分不同服务
management.metrics.tags.application=${spring.application.name}
management.endpoints.web.base-path=/
management.endpoints.web.path-mapping.metrics=prometheus
management.endpoints.web.path-mapping.prometheus=metrics
management.metrics.export.prometheus.enabled=true
management.metrics.export.jmx.enabled=true

# consul 服务器主机名
spring.cloud.consul.host=192.168.56.101
# consul 服务器端口
spring.cloud.consul.port=8500
spring.cloud.consul.discovery.health-check-url=http://XXXXX:8080/health
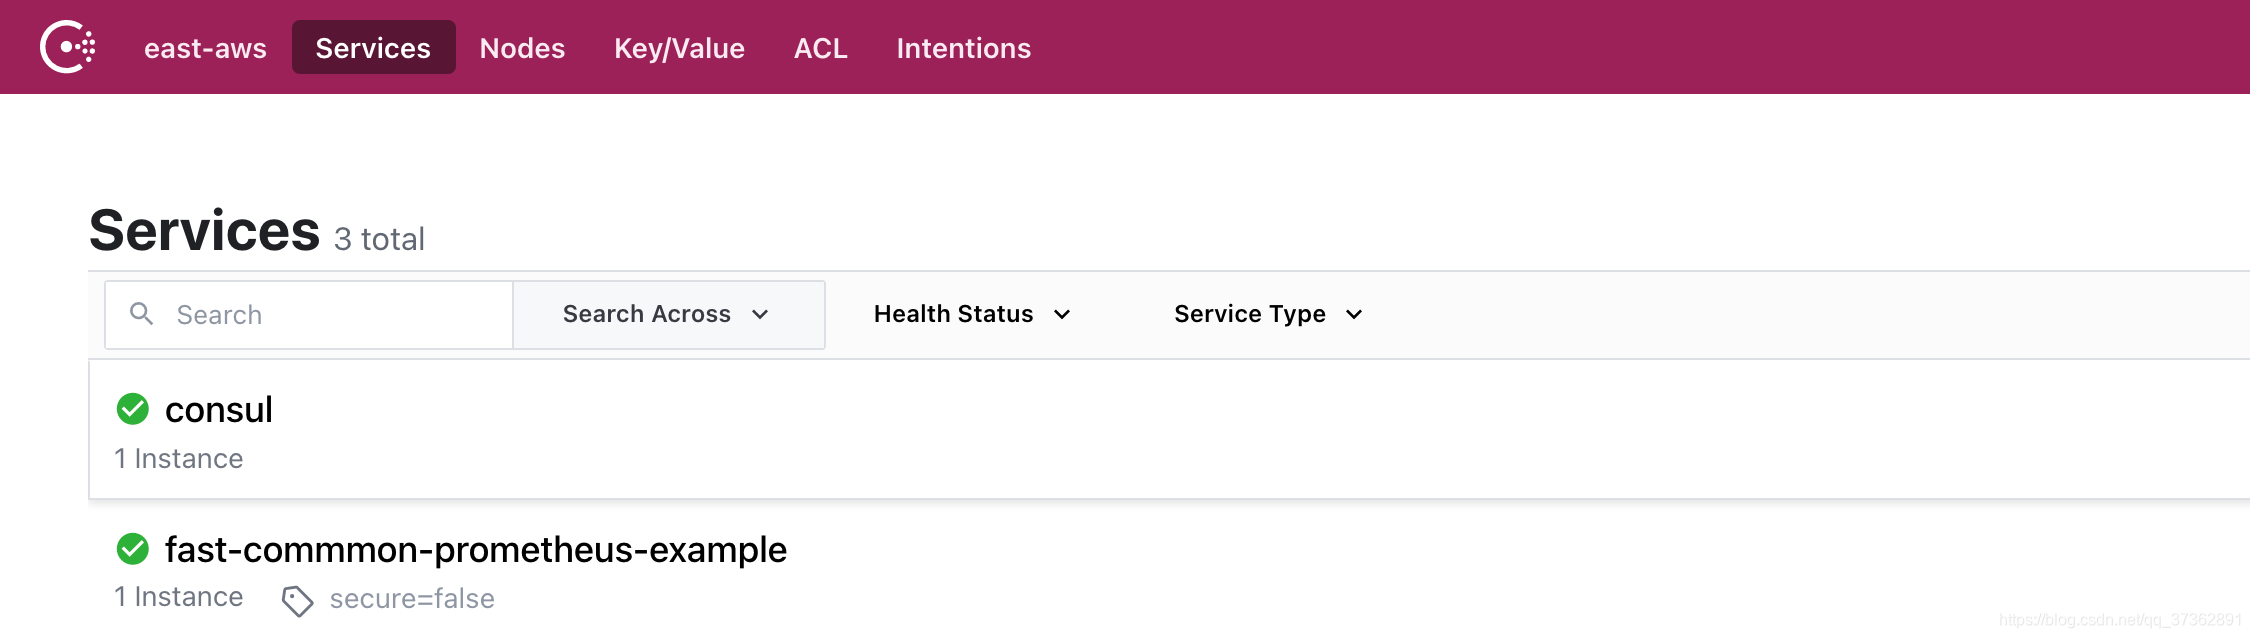
查看结果
- 服务已经注册上去了

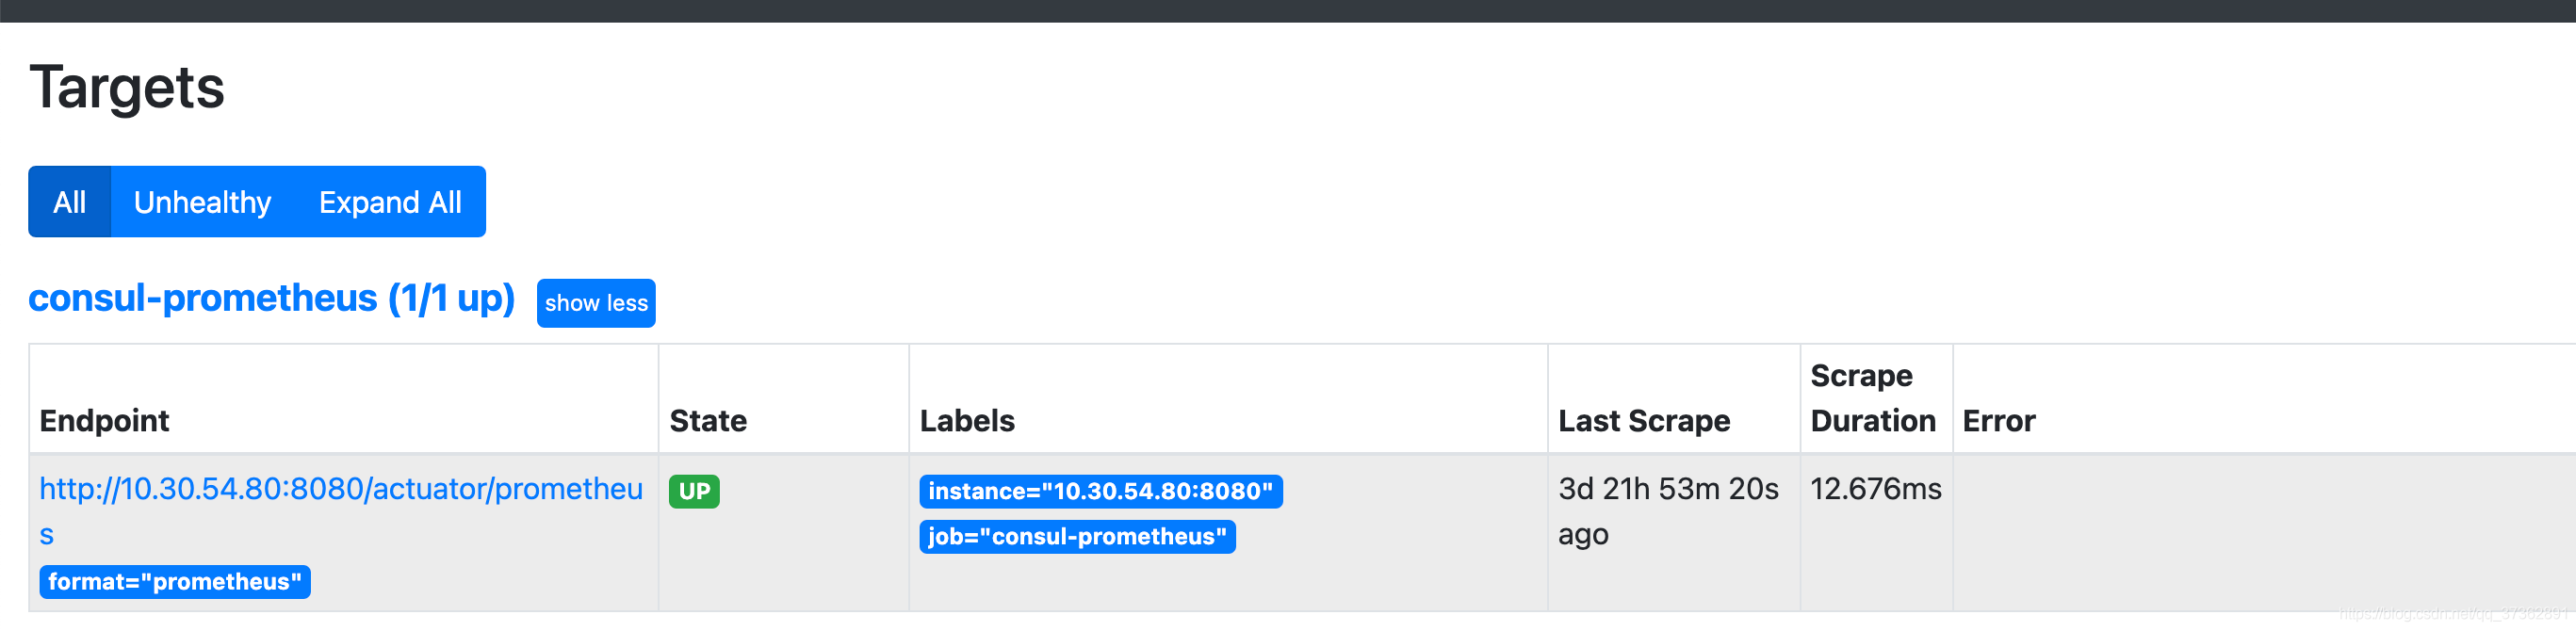
- 观察prometheus也已经监控到了
问题
prometheus 默认监控的是/metrics这个路径,我改了java项目中暴露的endpoint地址,对于线上生产环境来说,这个方法不可以取,太不方便了。
再次修改prometheus配置
  - job_name: 'consul-prometheus'
   # metrics_path: "/v1/agent/metrics"
    scrape_interval: 60s
    scrape_timeout: 10s
    scheme: http
    params:
      format: ['prometheus']
    #static_configs:
    #    - targets:
    #       - 192.168.56.101:8500
    consul_sd_configs:
      - server: '192.168.56.101:8500'
        services: []
    relabel_configs:
      - source_labels: [__metrics_path__]
        separator: ;
        regex: /metrics
        target_label: __metrics_path__
        replacement: /actuator/prometheus
        action: replace
      - source_labels: ['__meta_consul_tags']
        regex: '^.*,metrics=true,.*$'
        action: keep
-
metrics_path
这个配置是为了将 Prometheus 默认的拉取数据/metrics改成/actuator/prometheus -
__meta_consul_tags
这个配置是为了筛选指定tag的应用,只有有这个tag的应用才会拉取监控数据,这里是metrics=true,是在 Spring Boot的配置文件中配置的
修改java配置
spring.application.name=fast-commmon-prometheus-example
# 打开所有 Actuator 服务
management.endpoints.web.exposure.include=*
# 将应用名称添加到计量器的 tag 中去
# 以便 Prometheus 根据应用名区分不同服务
management.metrics.tags.application=${spring.application.name}
#management.endpoints.web.base-path=/
#management.endpoints.web.path-mapping.metrics=prometheus
#management.endpoints.web.path-mapping.prometheus=metrics
management.metrics.export.prometheus.enabled=true
management.metrics.export.jmx.enabled=true

# consul 服务器主机名
spring.cloud.consul.host=192.168.56.101

# consul 服务器端口
spring.cloud.consul.port=8500

##根据prometheus endpoint 配置
spring.cloud.consul.discovery.health-check-url=http://10.30.54.80:8080/actuator/health
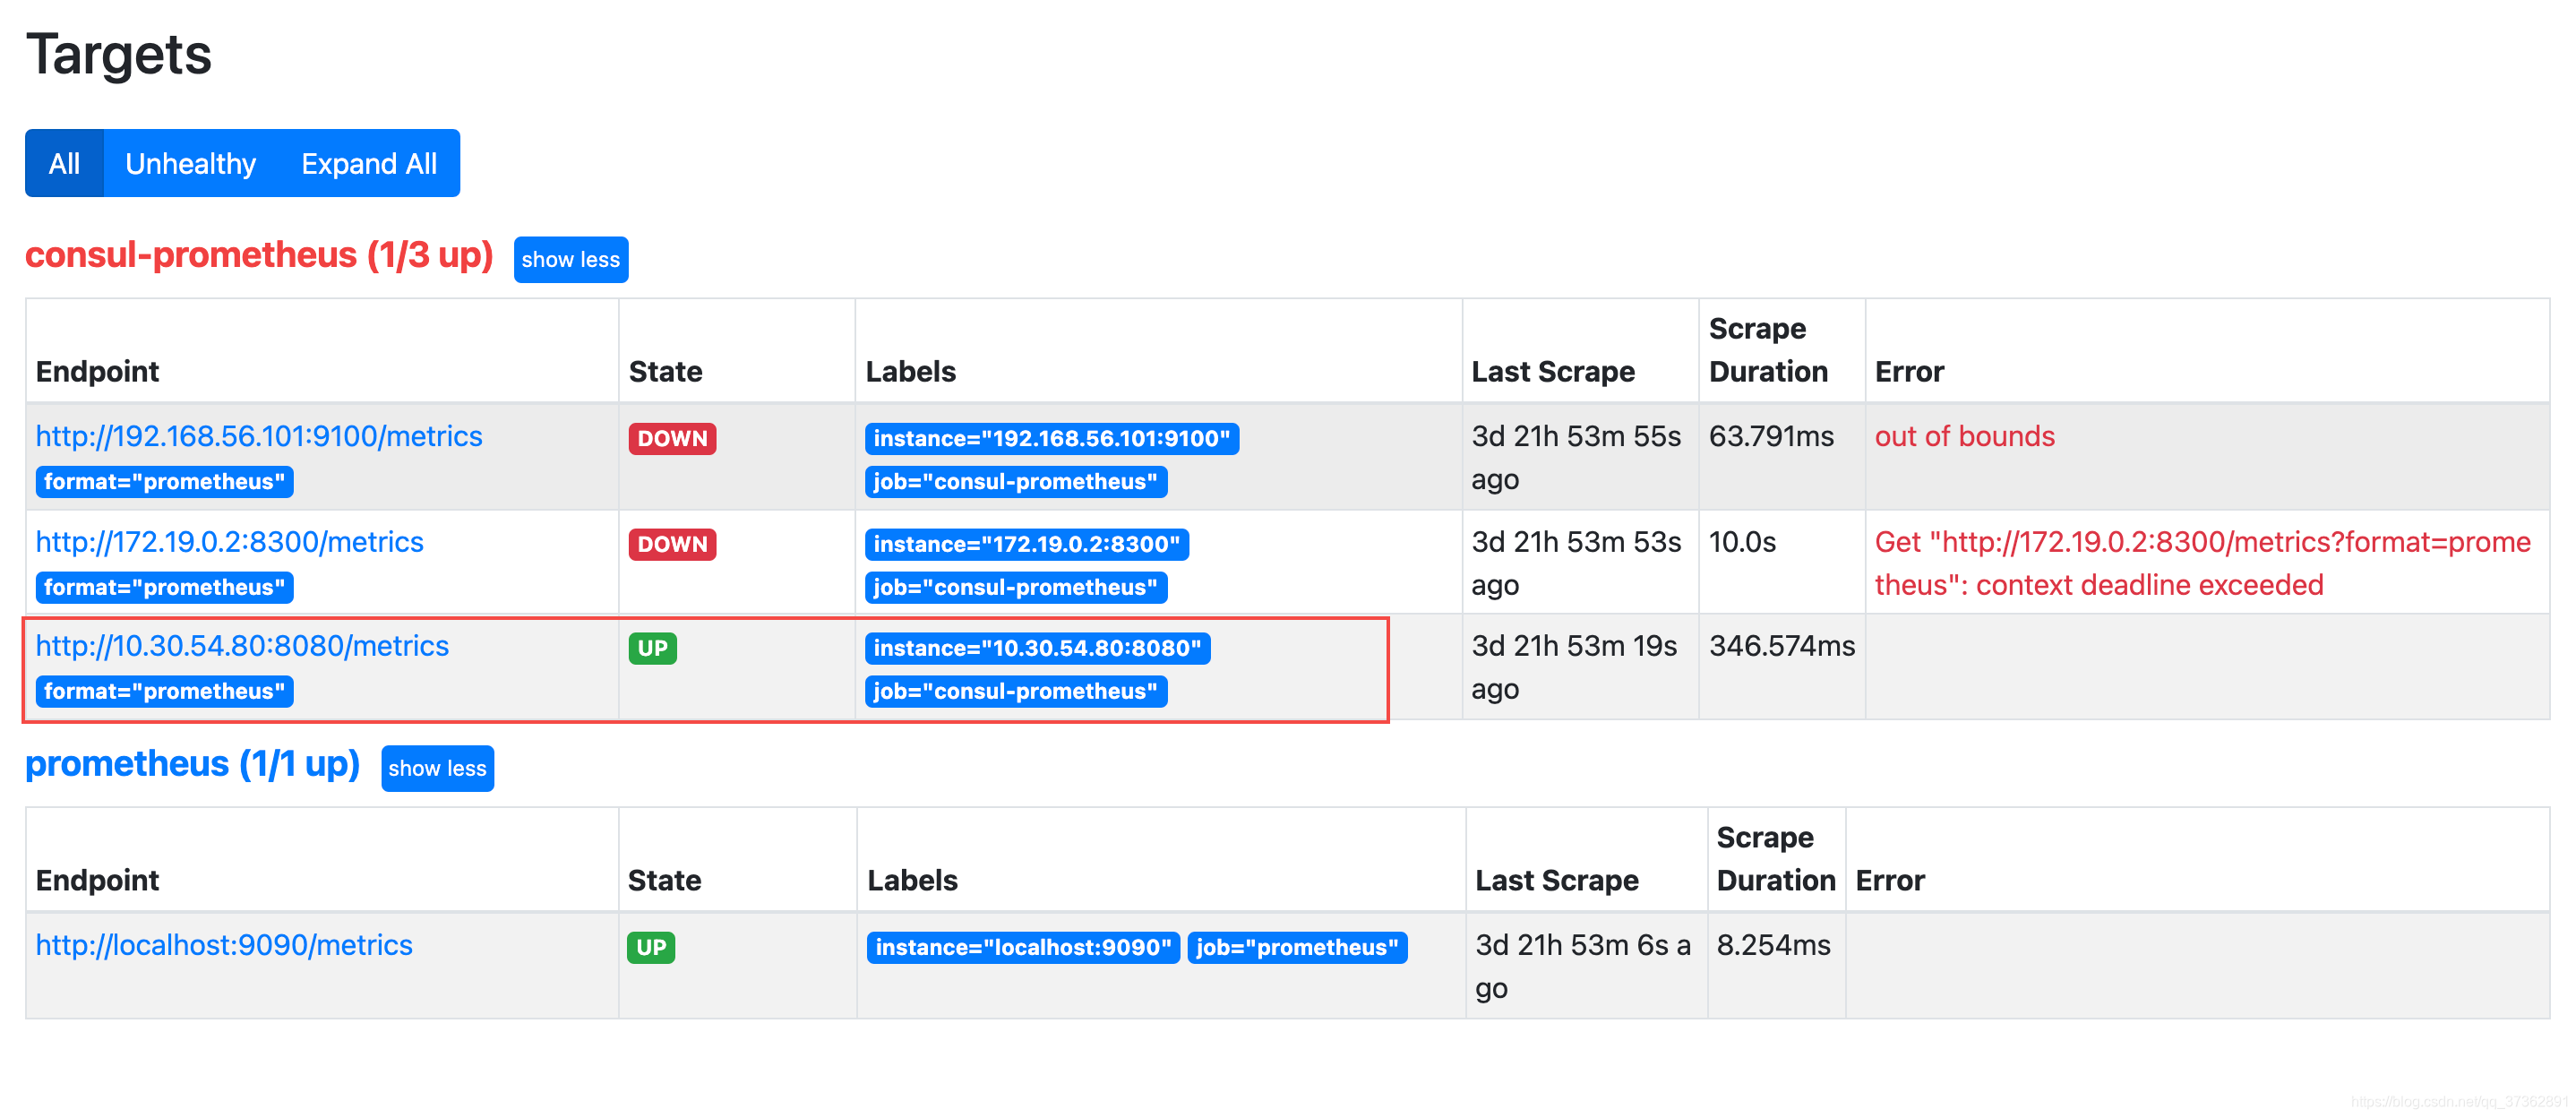
分别重新启动prometheus和java项目再次观察