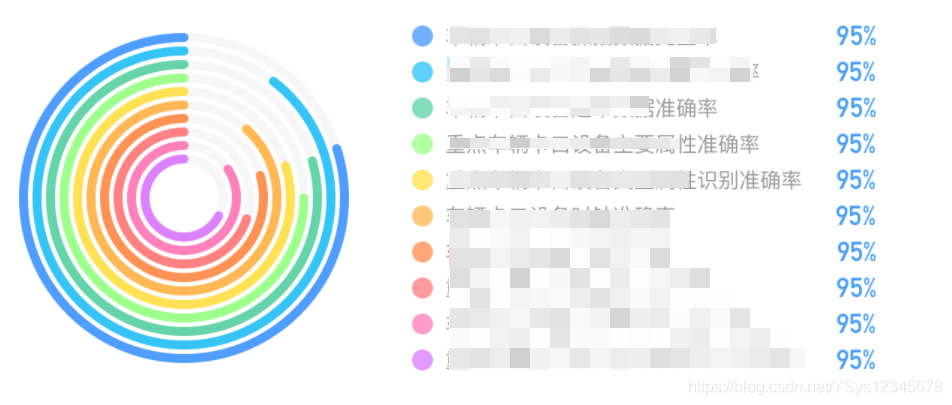
需要实现的效果图

分析如何实现
1、可以看到这个数据图标不是常规的echarts图,需要从echarts的更多资源去找类似的例子copy,找了一圈还真找到类似的如图:

2、例子找到了,大致也差不多,动手改。
3、两者之间的区别:
(1)圈的个数不同、颜色不同
(2)右侧文字字体的样式(字体、颜色等)
上代码
定义变量
//定义要用到的变量:
  series: [],
  maxRadius:  90,
  barWidth: 6,
  barGap: 2,
  // sumValue: 0,
  showValue: true,
  showPercent: true,
  option: {},
//图形数据
  PieDatas: [
            {
                "value": 95,
                "name": "XXXXXXXXXX数据XXXXXXXXXX完整率"
            },
            {
                "value": 95,
                "name": "XXXXXXXXXX数据XXXXXXXXXX完整率"
            },
            {
                "value": 95,
                "name": "XXXXXXXXXX数据XXXXXXXXXX完整率"
            },
            {
                "value": 95,
                "name": "XXXXXXXXXX数据XXXXXXXXXX完整率"
            },
            {
                "value": 95,
                "name": "XXXXXXXXXXXXXXXX完整率识别准确率"
            },
            {
                "value": 95,
                "name": "XXXXXXX完整率时钟准确率"
            },
            {
                "value": 95,
                "name": "车XXXXXXXXXX数据XXXXXXXXXX完整率上传率"
            },{
                "value": 95,
                "name": "XXXXXXXXXX数据XXXXXXXXXX完整率上传率"
            },{
                "value": 95,
                "name": "XXXXXXXXXX数据XXXXXXXXXX完整率可用率"
            },{
                "value": 95,
                "name": "XXXXXXXXXX数据XXXXXXXXXX完整率用率"
            },
        ],
//图形颜色
	BarColor:  [
            {
                "color1": "#4E9DFF",
                "color2": ""
            },
            {
                "color1": "#36C4F7",
                "color2": ""
            },
            {
                "color1": "#65D4AB",
                "color2": ""
            },
            {
                "color1": "#9FFF8D",
                "color2": ""
            },
            {
                "color1": "#FFE154",
                "color2": ""
            },
            {
                "color1": "#FFB854",
                "color2": ""
            },{
                "color1": "#FF9254",
                "color2": ""
            },{
                "color1": "#FF8181",
                "color2": ""
            },{
                "color1": "#FF81BA",
                "color2": ""
            },{
                "color1": "#DC81FF",
                "color2": ""
            },
        ],
绘制图形
this.pieDatas.map((item, i) => {
            this.series.push({
                type: 'pie',
                clockWise: false, //顺时加载
                hoverAnimation: false, //鼠标移入变大
                radius: [(this.maxRadius - i * (this.barGap + this.barWidth)) + '%', (this.maxRadius - (i + 1) * this.barWidth - i * this.barGap) + '%'],
                center: [ "30%", "50%"],
                label: {
                    show: false
                },
                itemStyle: {
                    label: {
                        show: false,
                    },
                    labelLine: {
                        show: false
                    },
                    borderWidth: 5,
                },
                data: [{
                    value: item.value,
                    name: item.name,
                    itemStyle: {
                        color: this.barColor[i].color1
                    }
                }, {
                    value: 100 - item.value,
                    name: '',
                    itemStyle: {
                        color: "transparent",
                    },
                    tooltip: {
                        show: false
                    },
                    hoverAnimation: false
                }]
            })
            this.series.push({
                name: 'blank',
                type: 'pie',
                silent: true,
                z: 0,
                clockWise: false, //顺时加载
                hoverAnimation: false, //鼠标移入变大
                radius: [(this.maxRadius - i * (this.barGap + this.barWidth)) + '%', (this.maxRadius - (i + 1) * this.barWidth - i * this.barGap) + '%'],
                center: [ "30%", "50%"],
                label: {
                    show: false
                },
                itemStyle: {
                    label: {
                        show: false,
                    },
                    labelLine: {
                        show: false
                    },
                    borderWidth: 5,
                },
                data: [{
                    value: 1,
                    itemStyle: {
                        color: "#f7f7f7",//圆圈另一半的颜色
                        borderWidth: 0
                    },
                    tooltip: {
                        show: false
                    },
                    hoverAnimation: false
                }]
            });

        })
		this.option = {
                    grid: {
                        left:  0,
                        right:  0,
                        top:  0,
                        bottom:  0,
                    },
                    backgroundColor: '#fff',
                    tooltip: {
                        show: true,
                        trigger: "item",
                    },
                    legend: {//右侧文字
                        show: true,
                        left: '50%',
                        top: 'middle',
                        icon: "circle",
                        itemWidth: 6,
                        itemHeight: 8,
                        itemGap:  5,
                        textStyle: {
                        	//右侧字体样式
                            rich: {
                                bothNameValue: {
                                    width: 300,  //给文字设置统一长度,保证右侧的百分比对齐
                                },
                                title: {
                                    fontSize: 14,
                                    lineHeight: 16,
                                    color: '#999999',
                                    width: 260,
                                },
                                value: {
                                    color: '#489DF7',
                                    fontSize: 18,
                                    fontFimely: 'DIN Alternate'
                                }
                            }
                        },
                        formatter: (name) => {
                                var datas = this.pieDatas;
                                let total = 0;
                                datas.map(item => {
                                    total += (item.value - 0)
                                })
                                let valueIndex = datas.map(item => item.name).indexOf(name);
                                let htmlValue = this.showPercent ? datas[valueIndex].value + "%" : ''
                                return "{title|" + name +  "} {value|" + htmlValue + "}"
                                // return name + "  " + (this.showPercent ? ((datas[valueIndex].value / total) * 100).toFixed(2) + "%" : '');
                            } ,

                    },
                    series: this.series,

            }


//最后把option放到echarts中就可以了
this.myChart.setOption(this.option);
最后
按照代码可以做出一样的图表出来,无脑复制会吧各位大佬。