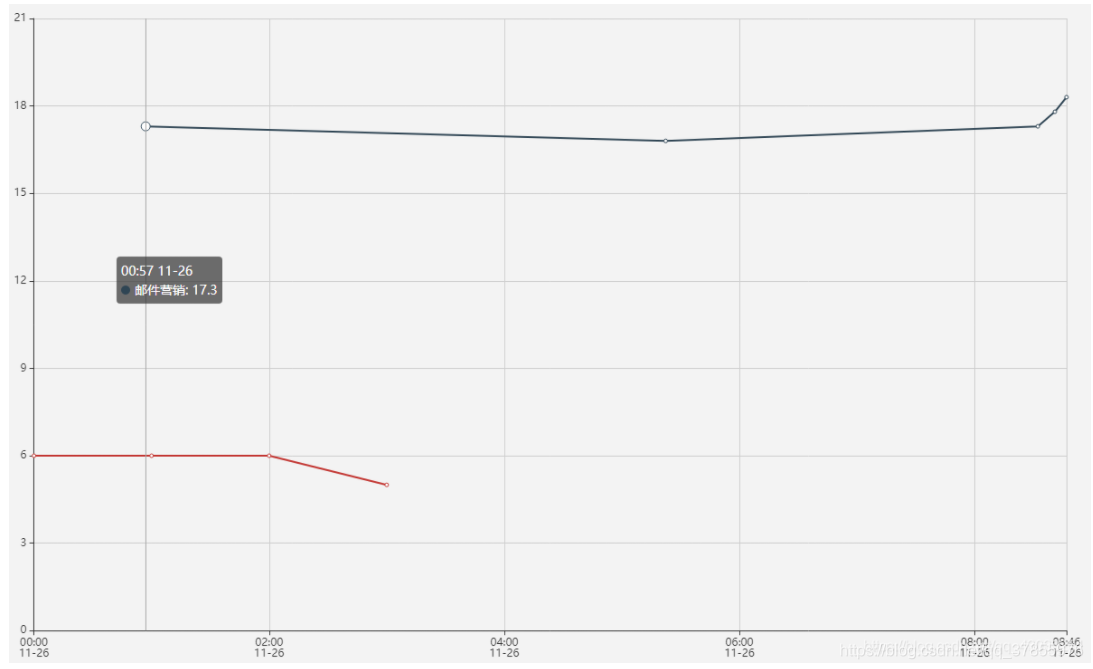
数据1:
 [
   [ "2020-11-26 00:00:00", "6" ], [ "2020-11-26 01:00:00", "6" ],
   [ "2020-11-26 02:00:00", '6' ], [ "2020-11-26 03:00:00", '5' ]
 ]
数据2:
 [
   [ "2020-11-26 00:57:00", "17.3" ], [ "2020-11-26 05:22:22", "16.8" ],
   [ "2020-11-26 08:32:16", '17.3' ], [ "2020-11-26 08:40:57", "17.8" ],
   [ "2020-11-26 08:46:54", '18.3' ]
 ]
var pageData1 = [];
var new_data = [];

new_data.push(arr[i][key][j].uDateTime);
new_data.push(arr[i][key][j].V3);

pageData1.push(new_data);
效果图:

?
option = {
    title: {
        text: '折线图堆叠'
    },
    tooltip: {
        trigger: 'axis'
    },
    legend: {
        data: ['邮件营销', '联盟广告']
    },

    xAxis: {
        // 根据x轴数据决定type类型
        type: 'time',
        boundaryGap: false,
        // 注: x轴不指定data,自动会从series取
    },
    yAxis: {
        type: 'value'
    },
    series: [
         {
            name: '联盟广告',
            type: 'line',data: [
                [
                '2020-11-26 00:00:00',
                "6"
            ],
            [
                "2020-11-26 01:00:00",
                "6"
            ],
            [
                "2020-11-26 02:00:00",
                "6"
            ],
            [
                "2020-11-26 03:00:00",
                "5"
            ]
            ]
        },
        {
            name: '邮件营销',
            type: 'line',
            data: [
                [
                "2020-11-26 00:57:00",
                "17.3"
            ],
            [
                "2020-11-26 05:22:22",
                "16.8"
            ],
            [
                "2020-11-26 08:32:16",
                "17.3"
            ],
            [
                "2020-11-26 08:40:57",
                "17.8"
            ],
            [
                "2020-11-26 08:46:54",
                "18.3"
            ]
            ]
        },

    ]
};
