echarts属性详解
完整代码在下方将给出,可根据本文档进行需要的设计
<template>
    <div class="chart" style="height: 500px"></div>
</template>
<script>
export default {
  methods: {
    // 初始化echart
    initChart() {
      var myChart = this.$echarts.init(document.querySelector(".chart"));
      let option = {
        title: {
          text: "数据表示",
        },
        // 鼠标悬浮 有显示数据
        tooltip: {
          trigger: "axis",
          axisPointer: {
            type: "cross",
            // 类型 line(直线)shadow(阴影)
            label: {
              backgroundColor: "#6a7985",
            },
          },
        },
        // 上方可选择的图线
        legend: {
          data: ["业务量", "营收"],
        },
        // 右上角的工具栏
        toolbox: {
          feature: {
            // 下载图片
            saveAsImage: {},
            magicType: {
              type: ["bar", "line", "stack"],
            },
          },
        },
        grid: {
          left: "3%",
          right: "4%",
          bottom: "3%",
          containLabel: true,
        },
        // x 轴
        xAxis: [
          {
            type: "category",
            boundaryGap: false,
            data: [
              "09-08",
              "09-09",
              "09-10",
              "09-11",
              "09-12",
              "09-13",
              "09-14",
            ],
          },
        ],
        // y 轴
        yAxis: [
          {
            type: "value",
          },
        ],
        // 真正构成画面的元素
        series: [
          {
            name: "营收",
            type: "line",
            stack: "总量",
            symbolSize: 8,
            areaStyle: {},
            emphasis: {
              focus: "series",
            },
            data: [220, 182, 191, 234, 290, 330, 310],
          },
          {
            name: "业务量",
            type: "line",
            stack: "总量",
            symbolSize: 8,
            areaStyle: {},
            emphasis: {
              focus: "series",
            },
            data: [120, 132, 101, 134, 90, 230, 210],
          },
        ],
      };
      myChart.setOption(option);
    },
  },
  mounted() {
    this.$nextTick(() => {
      this.initChart();
    });
  },
};
</script>
最终效果

title(图表标题)
title: {
   text: "数据表示",
},
大致效果:

tooltip(数据提示)
// 鼠标 悬浮 有 数据显示
tootip:{
    /**
     * 触发方式 具有 三种方式
     * axis  柱状图,折线图--轴
     * item  饼状图,散点图--无轴
     */
    trigger: "axis",

    axisPointer: {
      /**
       * 展示数据 有三种类型
       * cross  交叉
       * line   直线
       * shadow 阴影遮盖
       */
      type: "cross",
      // 显示标签
      label: {
        backgroundColor: "#6a7985",
        // 背景颜色
      },
    },
}
大致效果:

legend(选择哪些显示)
// 上方可选择的图线
  legend: {
    data: ["业务量", "营收"],
  },
大致效果:

toolbox(右上角–工具箱)
// 右上角的工具栏
  toolbox: {
    feature: {
      // 下载图片
      saveAsImage: {},
     /**
       * 切换 数据类型展示方式
       *  bar -- 柱状图
       *  line   折线图
       *  stack  堆叠
       */
      magicType: {
        type: ["bar", "line","stack"],
      },
    },
  },
大致效果:

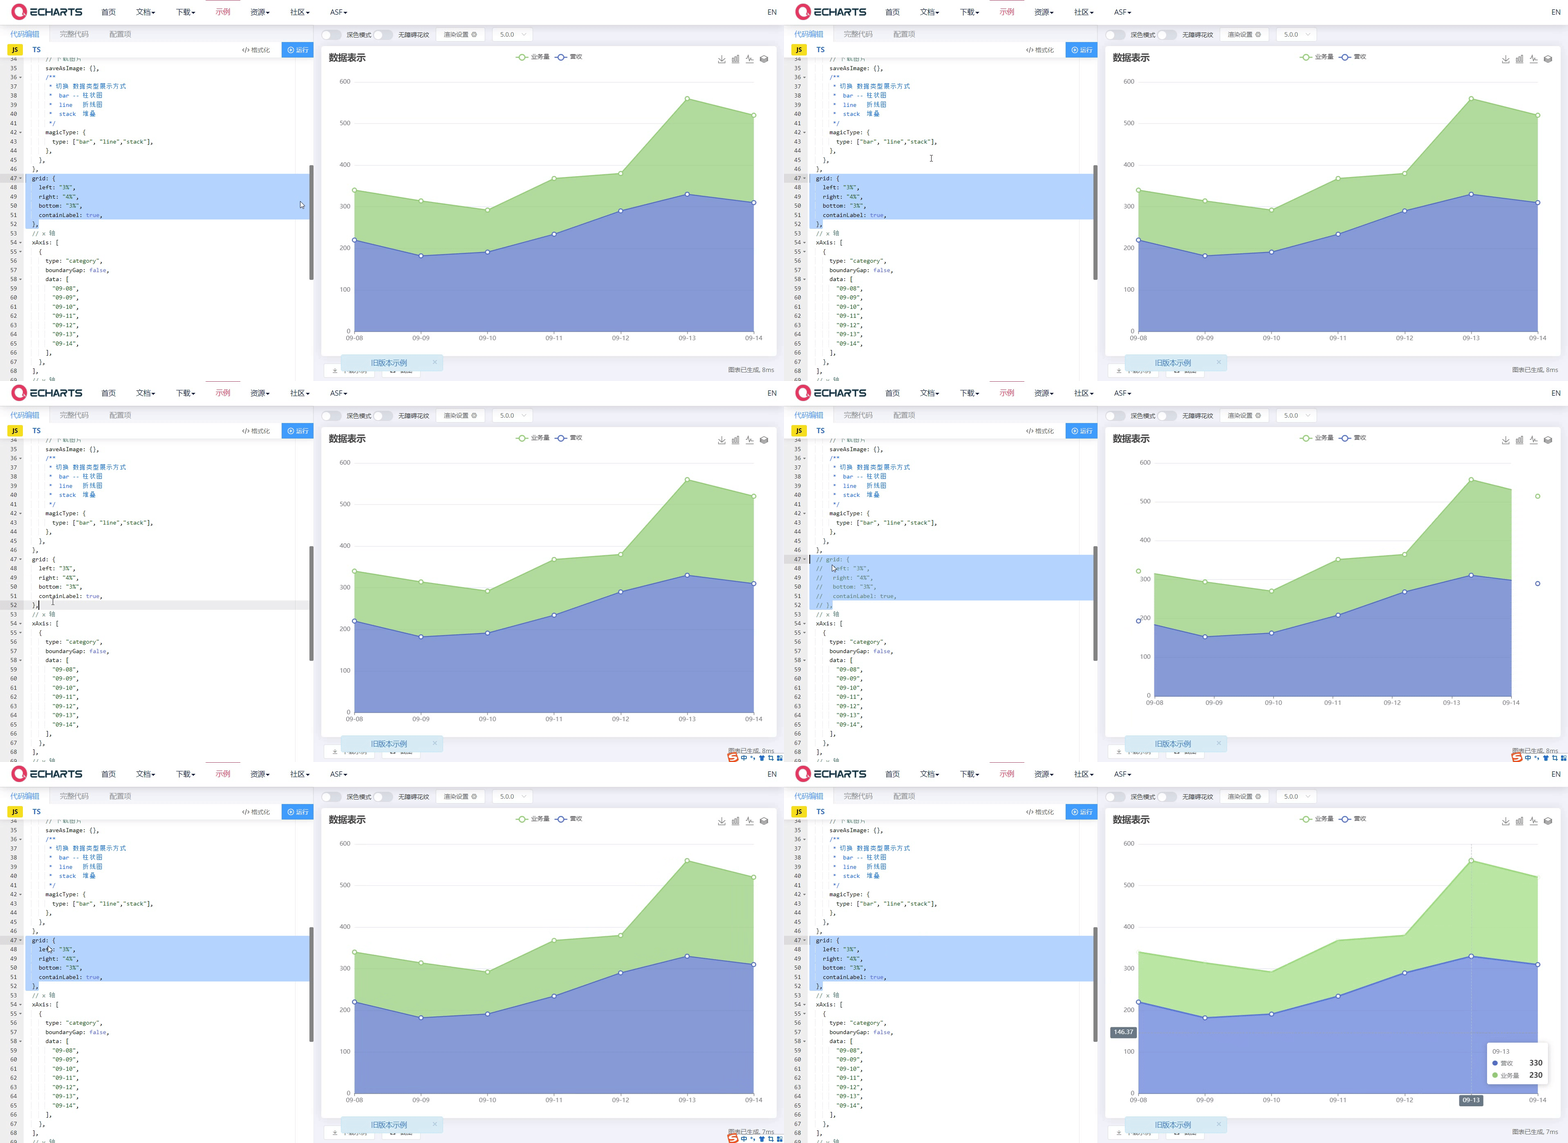
grid(这个有点懵逼)
grid: {
    left: "3%",
    right: "4%",
    bottom: "3%",
    containLabel: true,
  },

xAxis(设置x轴)
 xAxis: [
    {
      /**
       * 坐标轴类型
       * value      数值轴,适用于连续数据
       * category   离散类目数据
       * time       时间轴
       * log        对数轴
       */
      type: "category",
      // 不留白
      boundaryGap: false,
      // x轴数据
      data: [
        "09-08",
        "09-09",
        "09-10",
        "09-11",
        "09-12",
        "09-13",
        "09-14",
      ],
    },
  ],
yAxis(设置y轴)
yAxis: [
    {
      // 连续数据
      type: "value",
    },
  ],
series(构成画面的元素)
series: [
          {
            name: "营收", // 在tooltip显示的名字

            type: "line", // 图形类型

            stack: "总量",
            // 取消之后将没有areaSytle区分

            symbolSize: 8, // 折线结点大小
            areaStyle: {}, // 图形区域
            emphasis: {
              focus: "series", // 把另一个遮盖
            },
            data: [220, 182, 191, 234, 290, 330, 310],
          },
        ],
on(方法)
myChart.on("click", function (param){
	点击获取结点数据
}