1、formatter两种使用形式
可以通过函数和字符串模板来自定义formatter
①通过函数动态创建节点
通过循环param的长度,不写死节点,这样有一个好处就是当点击了某一个legend取消了数据的展示的时候,tooltip提示框不至于报错。
formatter: function (params) {
 ?  var result = "<div>" + params[0].axisValue + "</div>";
 ? ? ? ? ? ? ?  params.forEach(item=>{
 ? ? ? ? ? ? ? ?  if(item.data!==null){
 ? ? ? ? ? ? ? ? ?  let item1 =
 ? ? ? ? ? ? ? ? ?  "<span style='display:inline-block;margin-right:5px;margin-bottom:2px;border-radius:10px;width:9px;height:9px;background-color:"+
 ? ? ? ? ? ? ? ? ?  item.color +
 ? ? ? ? ? ? ? ? ?  ";'></span>"
 ? ? ? ? ? ? ? ? ?  item1 +=item.seriesName+":"+ __numFmt3(item.data,2)+'万元' + "<br/>"
 ? ? ? ? ? ? ? ? ?  result+=item1}
 ? ? ? ? ? ? ?  })
 ? ? ? ? ? ? ?  return result;
 },
②字符串模板的简易写法
 formatter: `{a|${curValue}%}`
 //设置的富文本
 rich: {
 ? ? a: {
 ? ? color:curColor,
 ? ? fontSize: 11,
 ? ? padding: [5,0,0,0]
 ? ? },
  }
当然也可以写成下面这种的echarts自带的形式
 //a(系列名称),b(数据项名称),c(数值), d(百分比)
formatter: '{a}{b}:{d}%'
2、蝴蝶图的绘制
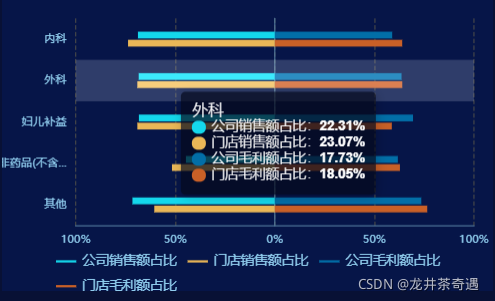
蝴蝶图绘制,即在y轴两端对齐的图表,通过设置series.stack为同一个,即可在同一个起点绘制。tooltip也是通过动态的方法设置的。y轴左侧的数据是通过将真实数据取反,然后通过将坐标轴及数据的取绝对值实现的。
第一次绘制这类的图形,还是比较特殊的,也并不算常见。
?由于图表的数据是通过异步请求获取到的,所以需要对传入的props通过setTimeout宏任务来进行控制,否则没有数据的情况下echarts会控制台报错。
   watch:{
		typePer:{
			handler(){
				setTimeout(()=>{
					this.showBar()
				},1000)
			},
			immediate:true
		}
	},
选项设置

series.push({
              type: "bar",
              name: '公司销售额占比',
              barWidth: 6,
              color: color[0],
              data: company_amt_rate,
              stack: 'company'
            })
            series.push({
              type: "bar",
              name: '门店销售额占比',
              barWidth: 6,
              color: color[1],
              data: store_amt_rate,
              stack: 'store'
            })
            series.push({
              type: "bar",
              name: '公司毛利额占比',
              barWidth: 6,
              color: color[2],
              data: company_pro_rate,
              stack: 'company'
            })
            series.push({
              type: "bar",
              name: '门店毛利额占比',
              barWidth: 6,
              color: color[3],
              data: store_pro_rate,
              stack: 'store'
            })

 //调用方法
showBar(){
			const dChart = this.$echarts.init(document.getElementById('leftBar'));
			//清除上一次的图像
			dChart.clear()
			//动态传入的legData,yData,series值
			let typePer=this.typePer
			const option = {
				legend: {
					bottom: -6,
					icon: 'rect',
					itemWidth: 18,
					itemHeight: 2,
					textStyle: {
						fontSize: 12,
						color: '#90CDEE'
					},
					data: typePer.legData
				},
				grid: {
					left: '15%',
					right: '4%',
					bottom: '23%',
					top:'5%'
				},
				tooltip:{
					trigger: 'axis',
					axisPointer: {
						type: 'shadow'
					},
					formatter: function (params, ticket, callback) {
						let s = ''
						params.forEach(item => {
							s += `<li class="item">
								<span class="point" style="background:${item.color};"></span>
								<span class="txt">${item.seriesName}:<span class="val" style="min-width:unset;">${item.data.real_tt_ || '0%'}</span></span>
							</li>`
						})
						return `<ul class="tooltip-20210730">
							<li class="tit">${params[0].name}</li>
							${s}
						</ul>`
					},
					borderWidth:'0',
					// 设置提示框背景
					backgroundColor: 'rgb(4,9,27,0.7)',
					textStyle: {
						fontSize: 10,
						fontWeight: 300,
						color: '#FFFFFF',
						lineHeight: 14
					},
				},
				xAxis: [
					{
						type: 'value',
						nameTextStyle: {
							color: '#90CDEE',
							fontSize: 10
						},
						splitLine: {
							lineStyle: {
								color: 'rgb(72,72,72)',
								type:'dashed'
							}
						},
						axisLine: {
							show: true,
							lineStyle: {
								color: 'rgb(84,124,159)',
								width: 1,
							}
						},
						axisLabel: {
							color: '#90CDEE',
							fontSize: 10,
							formatter: (val) => {
								return Math.abs(val) / 2 * 100 + '%';
							}
						},
						max: 2,
						min: -2
					}
				],
				yAxis: [
					{
						type: 'category',
						axisTick: {
							show: false
						},
						nameLocation: 'end',
						nameTextStyle: {
							color: '#90CDEE',
							fontSize: 10
						},
						splitLine: {
							lineStyle: {
								color: 'rgb(72,72,72)',
								type:'dashed'
							}
						},
						axisLine: {
							show: true,
							lineStyle: {
								color: 'rgb(84,124,159)',
								width: 1,
							}
						},
						axisLabel: {
							color: '#90CDEE',
							fontSize: 10,
							width: 62,
							overflow: 'truncate'
						},
						data: typePer.yData
					}
				],
				series: typePer.series
			};
			dChart && dChart.setOption(option)
		}