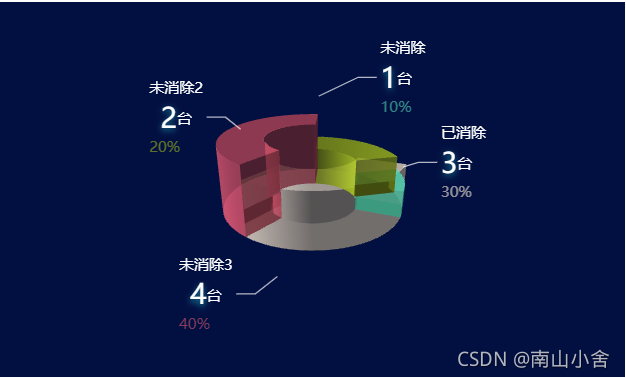
|

<!DOCTYPE html>
<html lang="en">
<head>
<meta charset="UTF-8">
<meta http-equiv="X-UA-Compatible" content="IE=edge">
<meta name="viewport" content="width=device-width, initial-scale=1.0">
<title>Document</title>
<style lang="">
#pie3D {
width: 500px;
height: 300px;
}
</style>
</head>
<body>
<div id="pie3D"></div>
<script src="./echarts.js"></script>
<script src="./echarts-gl.js"></script>
<script>
function getParametricEquation(startRatio, endRatio, isSelected, isHovered, k, height) {
let midRatio = (startRatio + endRatio) / 2;
let startRadian = startRatio * Math.PI * 2;
let endRadian = endRatio * Math.PI * 2;
let midRadian = midRatio * Math.PI * 2;
if (startRatio === 0 && endRatio === 1) {
isSelected = false;
}
k = typeof k !== 'undefined' ? k : 1 / 3;
let offsetX = isSelected ? Math.cos(midRadian) * 0.1 : 0;
let offsetY = isSelected ? Math.sin(midRadian) * 0.1 : 0;
let hoverRate = isHovered ? 1.05 : 1;
return {
u: {
min: -Math.PI,
max: Math.PI * 3,
step: Math.PI / 32
},
v: {
min: 0,
max: Math.PI * 2,
step: Math.PI / 20
},
x: function(u, v) {
if (u < startRadian) {
return offsetX + Math.cos(startRadian) * (1 + Math.cos(v) * k) * hoverRate;
}
if (u > endRadian) {
return offsetX + Math.cos(endRadian) * (1 + Math.cos(v) * k) * hoverRate;
}
return offsetX + Math.cos(u) * (1 + Math.cos(v) * k) * hoverRate;
},
y: function(u, v) {
if (u < startRadian) {
return offsetY + Math.sin(startRadian) * (1 + Math.cos(v) * k) * hoverRate;
}
if (u > endRadian) {
return offsetY + Math.sin(endRadian) * (1 + Math.cos(v) * k) * hoverRate;
}
return offsetY + Math.sin(u) * (1 + Math.cos(v) * k) * hoverRate;
},
z: function(u, v) {
if (u < -Math.PI * 0.5) {
return Math.sin(u);
}
if (u > Math.PI * 2.5) {
return Math.sin(u);
}
return Math.sin(v) > 0 ? 1 * height : -1;
}
};
}
function getPie3D(pieData, internalDiameterRatio) {
let series = [];
let sumValue = 0;
let startValue = 0;
let endValue = 0;
let legendData = [];
let k = typeof internalDiameterRatio !== 'undefined' ? (1 - internalDiameterRatio) / (1 + internalDiameterRatio) : 1 / 3;
for (let i = 0; i < pieData.length; i++) {
sumValue += pieData[i].value;
let seriesItem = {
name: typeof pieData[i].name === 'undefined' ? `series${i}` : pieData[i].name,
type: 'surface',
parametric: true,
wireframe: {
show: false
},
pieData: pieData[i],
pieStatus: {
selected: false,
hovered: false,
k: k
}
};
if (typeof pieData[i].itemStyle != 'undefined') {
let itemStyle = {};
typeof pieData[i].itemStyle.color != 'undefined' ? itemStyle.color = pieData[i].itemStyle.color : null;
typeof pieData[i].itemStyle.opacity != 'undefined' ? itemStyle.opacity = pieData[i].itemStyle.opacity : null;
seriesItem.itemStyle = itemStyle;
}
series.push(seriesItem);
}
for (let i = 0; i < series.length; i++) {
endValue = startValue + series[i].pieData.value;
console.log(series[i]);
series[i].pieData.startRatio = startValue / sumValue;
series[i].pieData.endRatio = endValue / sumValue;
series[i].parametricEquation = getParametricEquation(series[i].pieData.startRatio, series[i].pieData.endRatio, false, false, k, series[i].pieData.value);
startValue = endValue;
legendData.push(series[i].name);
}
let option = {
tooltip: {
formatter: params => {
if (params.seriesName !== 'mouseoutSeries') {
return `${params.seriesName}<br/><span style="display:inline-block;margin-right:5px;border-radius:10px;width:10px;height:10px;background-color:${params.color};"></span>${option.series[params.seriesIndex].pieData.value}`;
}
},
show: false
},
legend: {
show: false,
data: legendData,
textStyle: {
color: '#fff',
fontSize: 26
}
},
xAxis3D: {
min: -1,
max: 1
},
yAxis3D: {
min: -1,
max: 1
},
zAxis3D: {
min: -1,
max: 1
},
grid3D: {
show: false,
boxHeight: 20,
bottom: '50%',
environment: '#021041',
viewControl: {
distance: 300,
alpha: 25,
beta: 130,
},
},
series: series
};
return option;
}
var color = ['rgba(250,235,215,0.6)', 'rgba(80,212,175,0.6)', 'rgba(155,178,27,0.6)', 'rgba(220,86,111,0.6)']
var optionData = [{
name: '已消除',
value: 3,
itemStyle: {
opacity: 0.7,
color: 'red',
}
}, {
name: '未消除',
value: 1,
itemStyle: {
opacity: 0.7,
color: 'green',
}
}, {
name: '未消除2',
value: 2,
itemStyle: {
opacity: 0.7,
color: 'pink',
}
}, {
name: '未消除3',
value: 4,
itemStyle: {
opacity: 0.7,
color: 'orange',
}
}
]
function setLabel() {
optionData.forEach((item, index) => {
item.itemStyle = {
color: color[index]
}
item.label = {
normal: {
show: true,
color: color[index],
formatter: [
'{b|{b}}',
'{c|{c}}{b|台}',
'{d|{d}%}'
].join('\n'),
rich: {
b: {
color: '#fff',
lineHeight: 25,
align: 'left'
},
c: {
fontSize: 22,
color: '#fff',
textShadowColor: '#1c90a6',
textShadowOffsetX: 0,
textShadowOffsetY: 2,
textShadowBlur: 5
},
d: {
color: color[index],
align: 'left'
}
}
}
}
item.labelLine = {
normal: {
lineStyle: {
width: 1,
color: 'rgba(255,255,255,0.7)'
}
}
}
})
}
setLabel()
var statusChart = echarts.init(document.getElementById('pie3D'))
var pieoption = {}
pieoption = getPie3D(optionData, 2);
pieoption.series.push({
name: '电梯状态',
backgroundColor: 'transparent',
type: 'pie',
label: {
opacity: 1,
fontSize: 13,
lineHeight: 20
},
startAngle: -40,
clockwise: false,
radius: ['20%', '50%'],
center: ['50%', '50%'],
data: optionData,
itemStyle: {
opacity: 0
}
})
statusChart.setOption(pieoption)
</script>
</body>
</html>
|
