我先说一下我的需求把:
- 使用echarts图表或者百度地图实现点击省份展示对应的市级。
- 到了市级以后点击各个市显示对应的公司。
最后我还是使用了echarts来做。
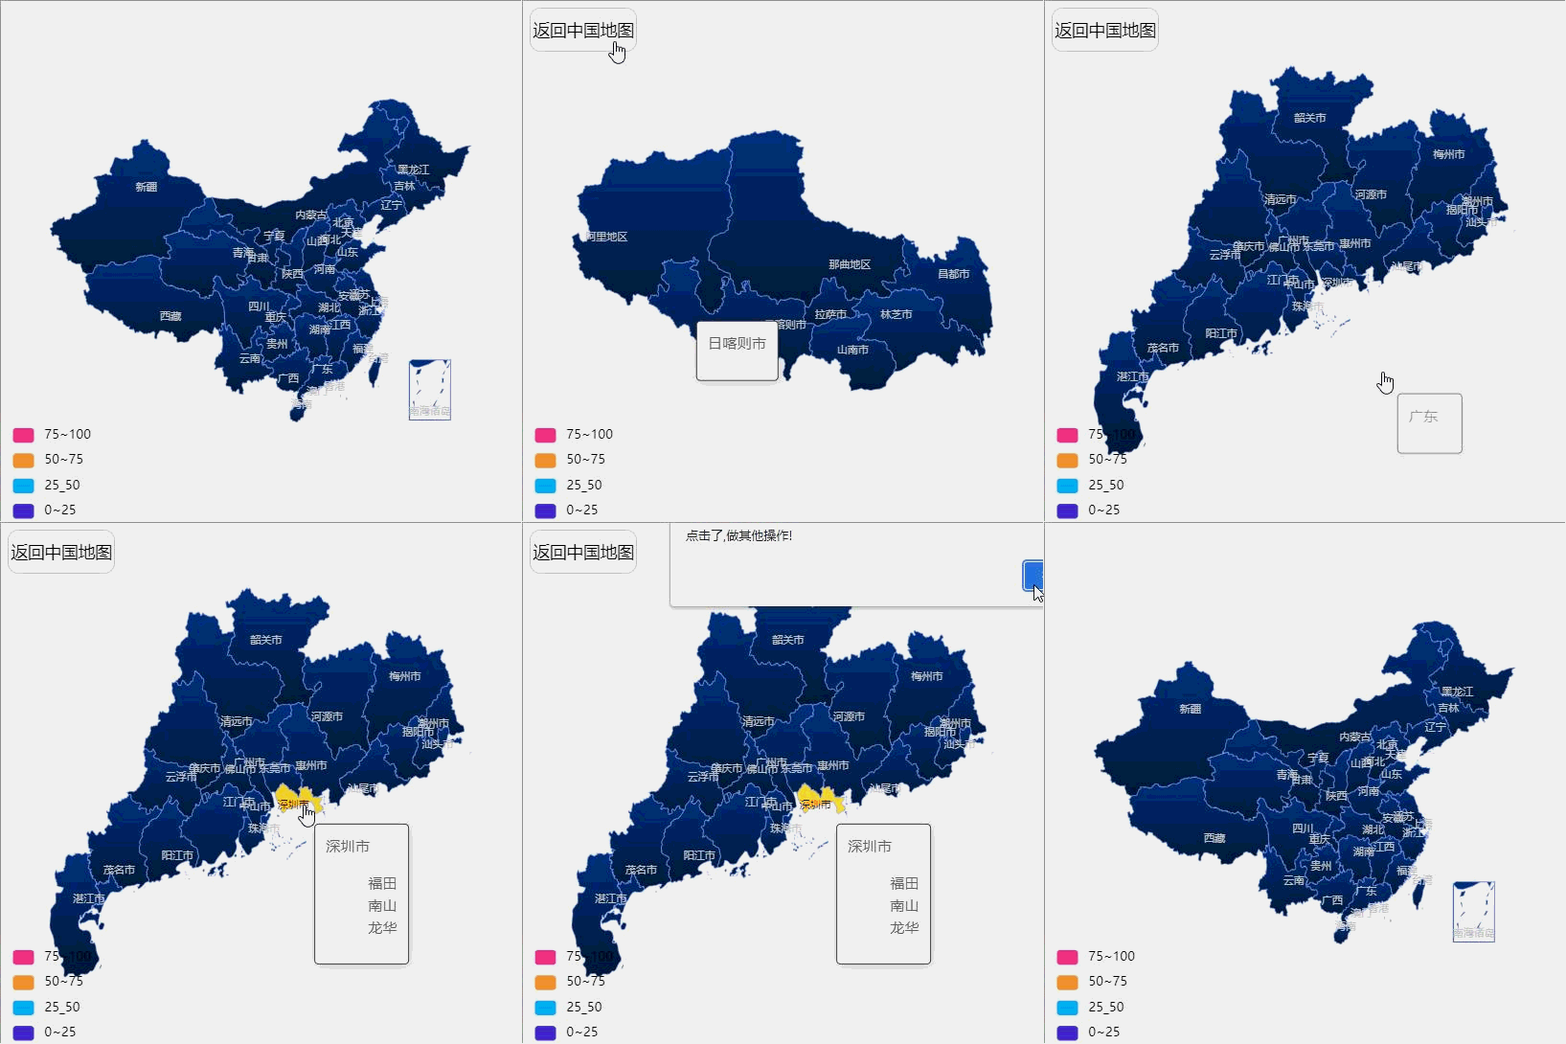
首先我们先看看效果图,如果是你的菜,麻烦点个赞,让更多的小伙伴一起学习起来。如图gif:

看完效果图,我们来实现把,具体我是自己起了一个vue项目工程
-
我们先把echarts依赖先装一下把,npm install echarts
装完以后,看看自己的package.json的版本,我怕到时候版本对应不上,所以用代码贴出来,图的话怕以后会丢失
"echarts": "^5.2.2",
如果需要改版本首先先卸载 npm uninstall echarts 完了之后在看看package.json是否还存在,一般情况下卸载完应该都没有了。
然后在根据你需要的版本安装 例如装@4.0.0 npm install echarts@4.0.0
然后需要在你的main.js放以下代码:
import * as echarts from 'echarts'

Vue.prototype.$echarts = echarts;
- 之后我写了一个echarts1.vue组件,代码贴出来:
<template>
<div>
<div class="echartsGroup">
<!-- 返回中国地图 -->
<div class="button" v-show="isReturnChina" @click="returnChinaFn()">返回中国地图</div>
<!-- echarts 图表 -->
<div ref="china_map" style="height: 100%;width: 100%"></div>
</div>
</div>
</template>
<script>
// import chinaJson from "../../assets/js/chinaJson"
import 'echarts/map/js/china.js' // 核心文件
require('echarts/theme/macarons') //
export default {
data() {
return {
mapData: [ //自己做的模拟数据 后续根据业务展示
{name: '湖北',value:88},
{name: '广东',value:24},
{name: '上海',value:5},
{name: '山东',value:15},
{name: '湖南',value:14},
{name: '重庆',value:0},
{name: '四川',value:65},
{name: '新疆',value:36},
{name: '黑龙江',value:12},
{name: '西藏',value:68},
{name: '青海',value:31},
{name: '内蒙古',value:28},
{name: '陕西',value:12},
{name: '辽宁',value:88},
{name: '云南',value:23},
],
provinceData:[ //省份公司的数据
{name: '深圳市',value:23,children:['福田','南山','龙华']},
],
provinces:{ //数据
台湾: 'taiwan',
河北: 'hebei',
山西: 'shanxi',
辽宁: 'liaoning',
吉林: 'jilin',
黑龙江: 'heilongjiang',
江苏: 'jiangsu',
浙江: 'zhejiang',
安徽: 'anhui',
福建: 'fujian',
江西: 'jiangxi',
山东: 'shandong',
河南: 'henan',
湖北: 'hubei',
湖南: 'hunan',
广东: 'guangdong',
海南: 'hainan',
四川: 'sichuan',
贵州: 'guizhou',
云南: 'yunnan',
陕西: 'shanxi1',
甘肃: 'gansu',
青海: 'qinghai',
新疆: 'xinjiang',
广西: 'guangxi',
内蒙古: 'neimenggu',
宁夏: 'ningxia',
西藏: 'xizang',
北京: 'beijing',
天津: 'tianjin',
上海: 'shanghai',
重庆: 'chongqing',
香港: 'xianggang',
澳门: 'aomen'
},
isReturnChina:false, //是否显示返回中国地图
options:null, //echarts 存数据
};
},
mounted() {
window.clickRoute= this.clickRoute;
this.$nextTick(_=>{
this.chinaMaprsult('china')
})
},
methods: {
// 中国地图点击省份 显示当前省份的详细的地区。
chinaMapHidden(chinaMap) {
let that = this
chinaMap.off('click')//这里解决多次触发点击事件 但是还会执行2次 引用echarts地图,点击各个省份时,点击一个调用两次接口,再点击一次,调用四次接口,再点击调用八次。。。。依次叠加,问题在于,没有将地图上的点击事件清空
chinaMap.on('click',async function(params){
if (params.name in that.provinces) {
let s = await import(`echarts/map/js/province/${that.provinces[params.name]}.js`);
if (s){
that.chinaMaprsult(params.name)
}
}
})
},
// 渲染地图
chinaMaprsult(name=null){
let _this = this;
name=='china'?this.isReturnChina=false:this.isReturnChina=true;
let chinaMap = this.$echarts.init(this.$refs.china_map)
this.options = {
// tooltip: { // 鼠标移到图里面的浮动提示框
// formatter:function (params) {
// return params.name
// }
// },
tooltip: { // 鼠标移到图里面的浮动提示框
trigger: 'item', //数据项图形触发
triggerOn: 'click', //这里根据业务需要给点击事件做跳转,所以不能做悬浮了,如果做悬浮 点击不了文字跳转
formatter: function(params) {
var name = params.name
var toolipData = []
_this.provinceData.forEach(item=>{
if(name == item.name){
toolipData = item.children
}
})
var htmlStr = ''
toolipData.forEach(item=>{
htmlStr += `<li class="list-li" name="${item}"><div οnclick="clickRoute()" >${item}</div></li>`
})
return `<div class="list-wrap"><div class="list-title">${name}</div><ul class="list-ul">${htmlStr}</ul></div>`
},
},
visualMap: { // 左下角展示
show: true,
min: 0,
max: 100,
left: 10,
bottom: 0,
showLabel: true,
textStyle: {
color: '#000'
},
pieces: [//左下角的切换数据显示
{
gt: 75,
lte: 100,
label: '75~100',
color: '#f7358c',
}, {
gt: 50,
lte: 75,
label: '50~75',
color: '#fb9632',
}, {
gt: 25,
lte: 50,
label: '25_50',
color: '#08b2ff',
}, {
gte: 0,
lte: 25,
label: '0~25',
color: '#4d2ed2'
}
]
},
// dataRange: {
//
// },
geo: {
map: name ? name : "china", // 核心
roam: false,
label: { // 页面初始化加载的文字
normal: {
show: true,
textStyle: {
color: "#ccc", // 页面初始化的地图文字颜色
fontSize:10// // 页面初始化的地图文字大小
},
},
},
itemStyle: { //设置样式
normal: {
borderWidth: .5, //区域边框宽度
borderColor: 'rgba(119, 156, 255, 1)',
areaColor: {
x: 0,
y: 0,
x2: 0,
y2: 1,
colorStops: [{
offset: 0,
color: '#073684' // 0% 处的颜色
}, {
offset: 1,
color: '#061E3D' // 100% 处的颜色
}],
},
},
emphasis: { // 移入背景颜色
// areaColor: '#ff00ff',
areaColor: '#F9D92E',
show: true,
textStyle: {
color: '#000',
fontSize: "12px"
}
},
},
},
series: [
{
type: "map",
geoIndex: 0,
itemStyle: {//地图区域的多边形 图形样式
normal: {//是图形在默认状态下的样式
label: {
show: true,//是否显示标签
textStyle: {
color: "black"
}
}
},
zoom: 1.5, //地图缩放比例,默认为1
emphasis: {//是图形在高亮状态下的样式,比如在鼠标悬浮或者图例联动高亮时
label: { show: true }
}
},
label: {
normal: {
show: true, //显示省份标签
textStyle:{color:"#696969"},//省份标签字体颜色
},
emphasis: {
show: true,
textStyle: {
}
}
},
data: [ // 地图数据
],
},
{
type: 'effectScatter',
coordinateSystem: 'geo',
rippleEffect: {
brushType: 'fill',
scale:0
},
showEffectOn: 'render',
label: {
lineHeight: 30,
normal: {
show: true,
color: '#081727',
position: 'inside',
padding:[5,0,0,0],
verticalAlign: 'middle',
formatter: function(para) {
return '{cnNum|' + para.data.value[2] + '}'
// return para.data.value[2]
},
rich: {
cnNum: {
fontSize: 16,
color: '#081727',
lineHeight:28,
}
}
},
},
symbol: 'roundRect',
// symbolRotate: 20,
symbolSize: [40,28],
data: this.convertData(this.mapData),
zlevel: 1,
}
],
}
chinaMap.setOption(this.options)
this.chinaMapHidden(chinaMap)
},
// 返回中国地图
returnChinaFn(){
this.chinaMaprsult('china');
},
// 点击跳转页面
clickRoute(){
alert("点击了,做其他操作!")
// this.$router.push('/')
},
// 处理数据格式
// handleData(outdata){
// var geoCoordMap = {};
// var mapFeatures = chinaJson.features
// mapFeatures.forEach(function(v) {
// // 名称
// var name = v.properties.name;
// // 经纬度
// geoCoordMap[name] = v.properties.cp;
// });
// var res = [];
// for (var i = 0; i < outdata.length; i++) {
// var geoCoord = geoCoordMap[outdata[i].name];
// if (geoCoord) {
// res.push({
// name: outdata[i].name,
// value: geoCoord.concat(outdata[i].value),
// });
// }
// }
// return res;
// },
}
}
</script>
<style scoped>
.echartsGroup{
width: 500px;
height: 500px;
position:relative;
}
.echartsGroup .button{
width:100px;
height:40px;
line-height:40px;
text-align:center;
border:1px solid #ccc;
border-radius: 10px;
cursor: pointer;
position:absolute;
top:10px;
left:10px;
z-index:99;
}
</style>
<style>
.list-ul{
list-style: none;
}
.list-li{
pointer-events: all;
cursor: pointer;
}
</style>
然后跑起来把,npm run serve --》
报错了,具体错误我也把代码贴出来和图片
代码如下:
These dependencies were not found:

* echarts/map/js/china.js in ./node_modules/cache-loader/dist/cjs.js??ref--13-0!./node_modules/babel-loader/lib!./node_modules/cache-loader/dist/cjs.js??ref--1-0!./node_modules/vue-loader-v16/dist??ref--1-1!./src/views/echarts1.vue?vue&type=script&lang=js
* echarts/map/js/province in ./node_modules/cache-loader/dist/cjs.js??ref--13-0!./node_modules/babel-loader/lib!./node_modules/cache-loader/dist/cjs.js??ref--1-0!./node_modules/vue-loader-v16/dist??ref--1-1!./src/views/echarts1.vue?vue&type=script&lang=js

To install them, you can run: npm install --save echarts/map/js/china.js echarts/map/js/province
图片如下:(怕图片久了之后会丢失,所以上面贴了代码,一样的)

切入正题了,
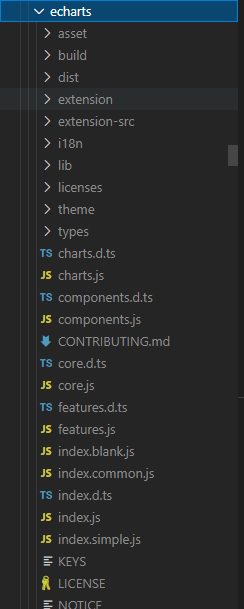
遇事不要慌张,我们就沿着路径去找,当然 这这路径肯定在node_modules文件夹中的echarts,
我们主要在node_modules文件夹中看看有没有这两个文件:
1.echarts/map/js/china.js
2.echarts/map/js/proince
这个我来贴图把:

没有的原因是,npm install echarts 包里面没有带map文件夹的内容,需要自己去找。
答案是没有的,这个我也是在npm官网找,更不用说,是没有的。
然后找了各种资源都是要money,所以最后我找了一个免费的博主
首先先谢谢这位博主放到百度网盘了:
地址为:https://blog.csdn.net/Murphy_six/article/details/117400961
可以跳转这个,更快到达
拉到最下面 有个网盘,具体你们去下载:
下载完之后是这样的,如图:

文字也注释一下把,怕图片丢失;有一个压缩文件,减压后里面有js和json两个文件夹,这样就好了。
然后我也备注一下我自己放在哪个文件下,备份一下,怕到时你们找我要,当然我这个记录我自己的码云(私有)下面的,需要的话到时候丢你们。
码云:task/地图资源/echarts地图js数据文件.zip
然后把这两个文件夹放在模块中的echarts文件夹中:
创建一个文件夹名字为:map
然后放进去就好了,如图:

丢完进去以后,重启一下服务就好了。
以上的功能就基本完成了。
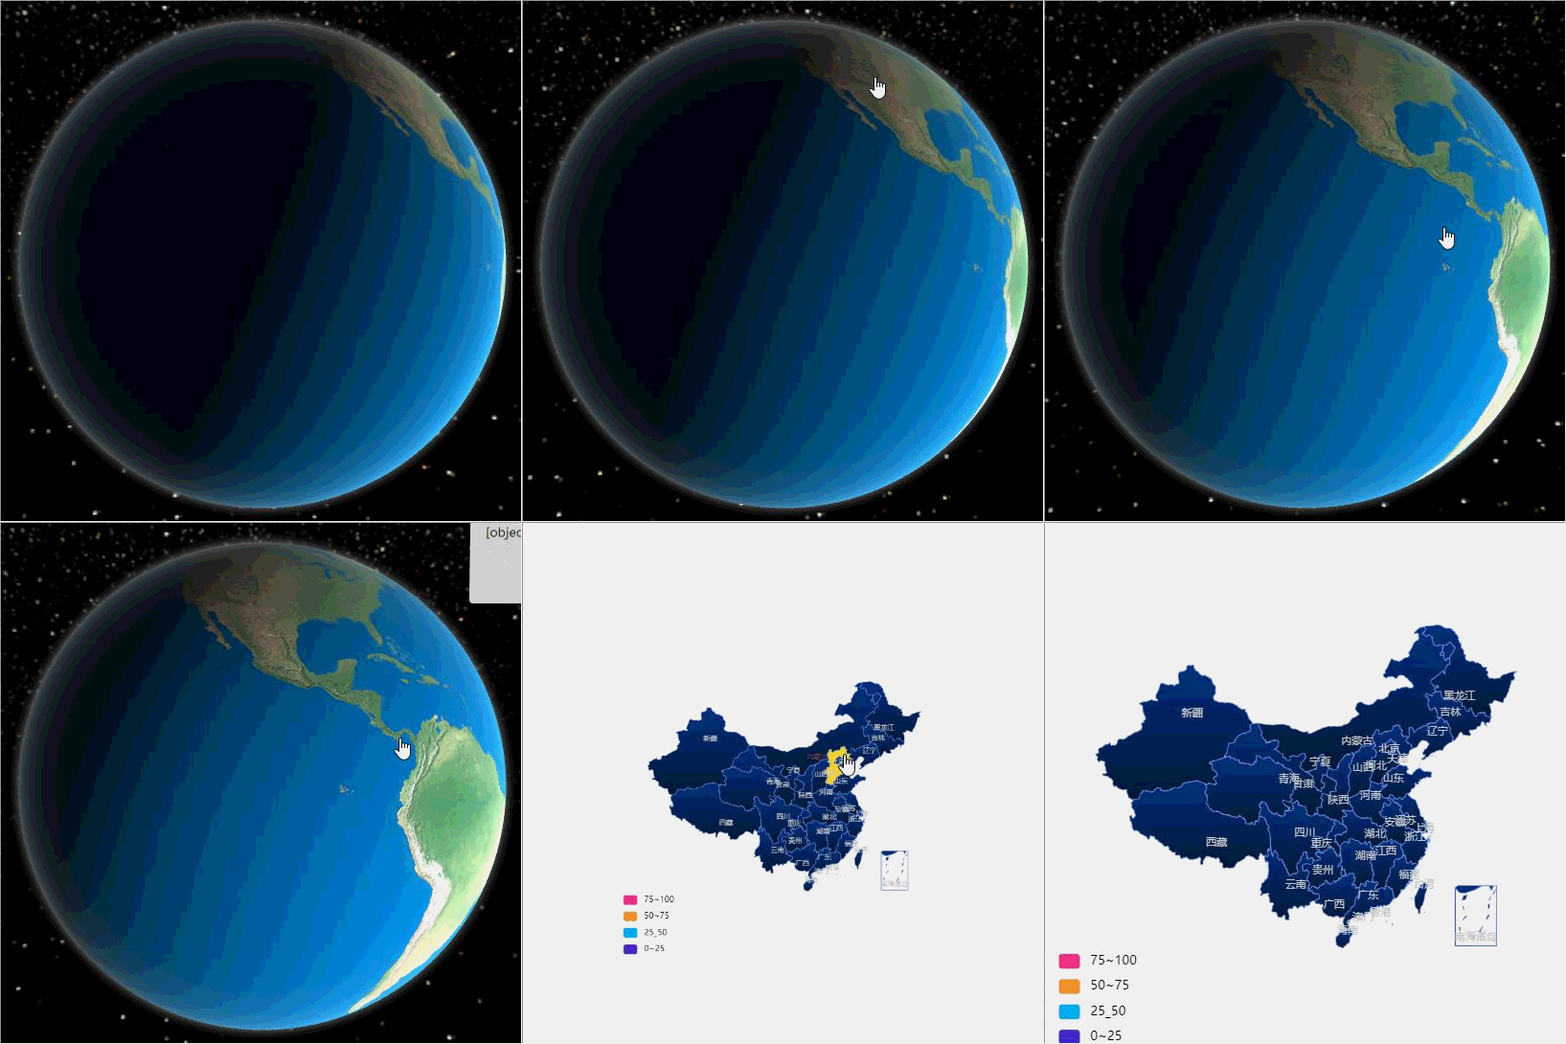
以下玩了一下效果:如图,需要的就继续往下看代码,谢谢!

这里是双击事件地图。
首先安装一下echarts 3D地球的依赖
npm install echarts-gl
echarts官网上也有:https://echarts.apache.org/examples/zh/editor.html?c=globe-atmosphere&gl=1
echarts1.vue 组件没变化,具体代码在上面;
echarts2.vue代码如下:贴代码
<template>
    <div id="pageBody" style="width:100%;height:100%;">
       <div id="box1" style="width: 100%; height: 100%;"></div>
    </div>
</template>
<script>
import 'echarts-gl';
export default {
    data() {
        return{
        }
    },
    methods: {
       drawChina() {
           var ROOT_PATH =
  'https://cdn.jsdelivr.net/gh/apache/echarts-website@asf-site/examples';
           console.log("执行了吗?")
            let _this  = this;
                // 初始化echarts实例
            var myEcharts = this.$echarts.init(document.getElementById("box1"));
            var option = {
                backgroundColor: '#000',
                globe: {
                    baseTexture: ROOT_PATH + '/data-gl/asset/earth.jpg',
                    shading: 'lambert',
                    environment: ROOT_PATH + '/data-gl/asset/starfield.jpg',
                    atmosphere: {
                        show: true
                    },
                    light: {
                        ambient: {
                            intensity: 0.1
                        },
                        main: {
                            intensity: 1.5
                        }
                    }
                },
                series: []
            };
            // 使用刚指定的配置项和数据显示图表。
            myEcharts.setOption(option);
            myEcharts.getZr().on('dblclick',function(e){
              alert(e);
              _this.$emit('isRealEcartsFnChild');
            });
            myEcharts.resize(); // 直接加这句即可
        },

    },
    mounted() {
        this.$nextTick(()=>{
            setTimeout(() => {
                this.drawChina()
            }, 1000);
        })
    }
}
</script>
继续贴home.vue代码:
<template>
    <div class="home">
        <EchartsComp1 v-if="!isRealEcarts" class="ecAnimation"></EchartsComp1>
        <EchartsComp2 v-if="isRealEcarts" @isRealEcartsFnChild='isRealEcartsFn'></EchartsComp2>
    </div>
</template>

<script>
import EchartsComp1 from './echarts1.vue'
import EchartsComp2 from './echarts2.vue'
export default {
    name:'home',
    components:{
        EchartsComp1,
        EchartsComp2,
    },
    data(){
        return {
            isRealEcarts:true,  //显示真实操作的echarts
        }
    },
    methods:{
        dbclickFn(){
            alert(1);
        },
        isRealEcartsFn(){
            this.isRealEcarts = false
        }
    }
}
</script>

<style scoped>
    .home{
        width:500px;
        height:500px;
        border:1px solid #ccc;
    }
    .ecAnimation{
        animation-name: enlarge;
        animation-duration: 1s;
        animation-timing-function:linear;
        animation-delay: 0s;
        animation-iteration-count: 1;
        animation-direction: normal;
        animation-play-state: running;
        animation-fill-mode: none;
    }
    @keyframes enlarge{
        0%{transform:scale(0);}
        30%{transform:scale(0.3);}
        60%{transform:scale(0.6);}
        100%{transform:scale(1);}
    }
</style>
完。
如有喜欢的小伙伴,或解决你的问题,麻烦点个赞,以便后续的小伙伴需要,谢谢
学到的就要教人,赚到的就要给人。