<!DOCTYPE html>
<html>
<head>
    <meta name="viewport" content="width=device-width"/>
    <title>ECharts 关系图谱</title>
    <script src="jquery-1.10.2.min.js"></script>
    <script src="echarts.min.js"></script>
    <style type="text/css">
        html, body, #main {
            height: 100%;
            width: 100%;
            margin: 0;
            padding: 0
        }
    </style>
</head>
<body>
<div id="main" style=""></div>
<script type="text/javascript">
    var myChart = echarts.init(document.getElementById('main'));
    option = {
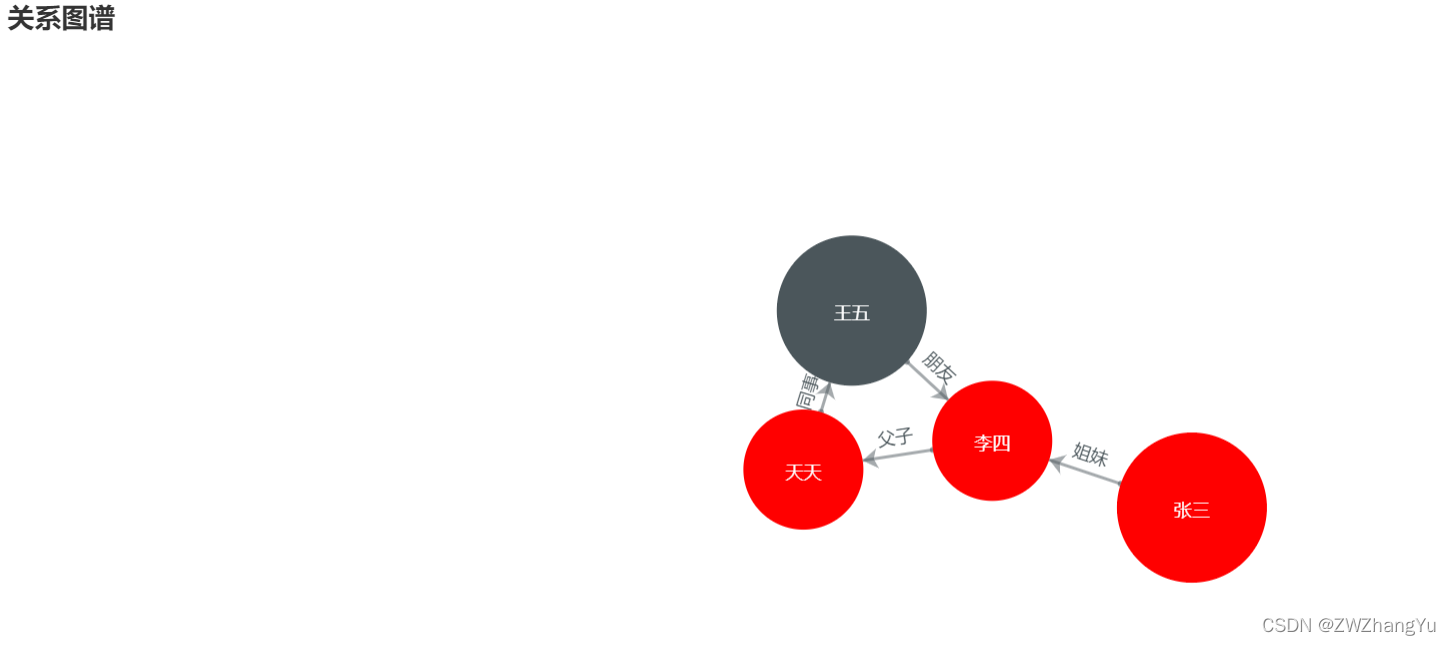
        title: {text: '关系图谱'},
        tooltip: {
            formatter: function (x) {
                return x.data.des;
            }
        },
        series: [
            {
                type: 'graph',
                layout: 'force',
                symbolSize: 80,
                roam: true,
                edgeSymbol: ['circle', 'arrow'],
                edgeSymbolSize: [4, 10],
                edgeLabel: {
                    normal: {
                        textStyle: {
                            fontSize: 20
                        }
                    }
                },
                force: {
                    repulsion: 2500,
                    edgeLength: [10, 50]
                },
                draggable: true,
                itemStyle: {
                    normal: {
                        color: '#4b565b'
                    }
                },
                lineStyle: {
                    normal: {
                        width: 2,
                        color: '#4b565b'

                    }
                },
                edgeLabel: {
                    normal: {
                        show: true,
                        formatter: function (x) {
                            return x.data.name;
                        }
                    }
                },
                label: {
                    normal: {
                        show: true,
                        textStyle: {}
                    }
                },
                data: [
                    {
                        name: '张三',
                        des: '退休',
                        symbolSize: 100,
                        itemStyle: {
                            normal: {
                                color: 'red'
                            }
                        }
                    }, {
                        name: '李四',
                        des: '自己创业',
                        itemStyle: {
                            normal: {
                                color: 'red'
                            }
                        }
                    }, {
                        name: '王五',
                        des: '测试人员',
                        symbolSize: 100
                    }, {
                        name: '天天',
                        des: '程序员',
                        itemStyle: {
                            normal: {
                                color: 'red'
                            }
                        }
                    }
                ],
                links: [
                    {
                        source: '张三',
                        target: '李四',
                        name: '姐妹',
                        des: '张三与户主【李四】关系为姐妹'
                    }, {
                        source: '王五',
                        target: '李四',
                        name: '朋友'
                    }, {
                        source: '天天',
                        target: '王五',
                        name: "同事"
                    }, {
                        source: '李四',
                        target: '天天',
                        name: "父子"
                    }
                    ]
            }
        ]
    };
    myChart.setOption(option);
</script>
</body>
</html>