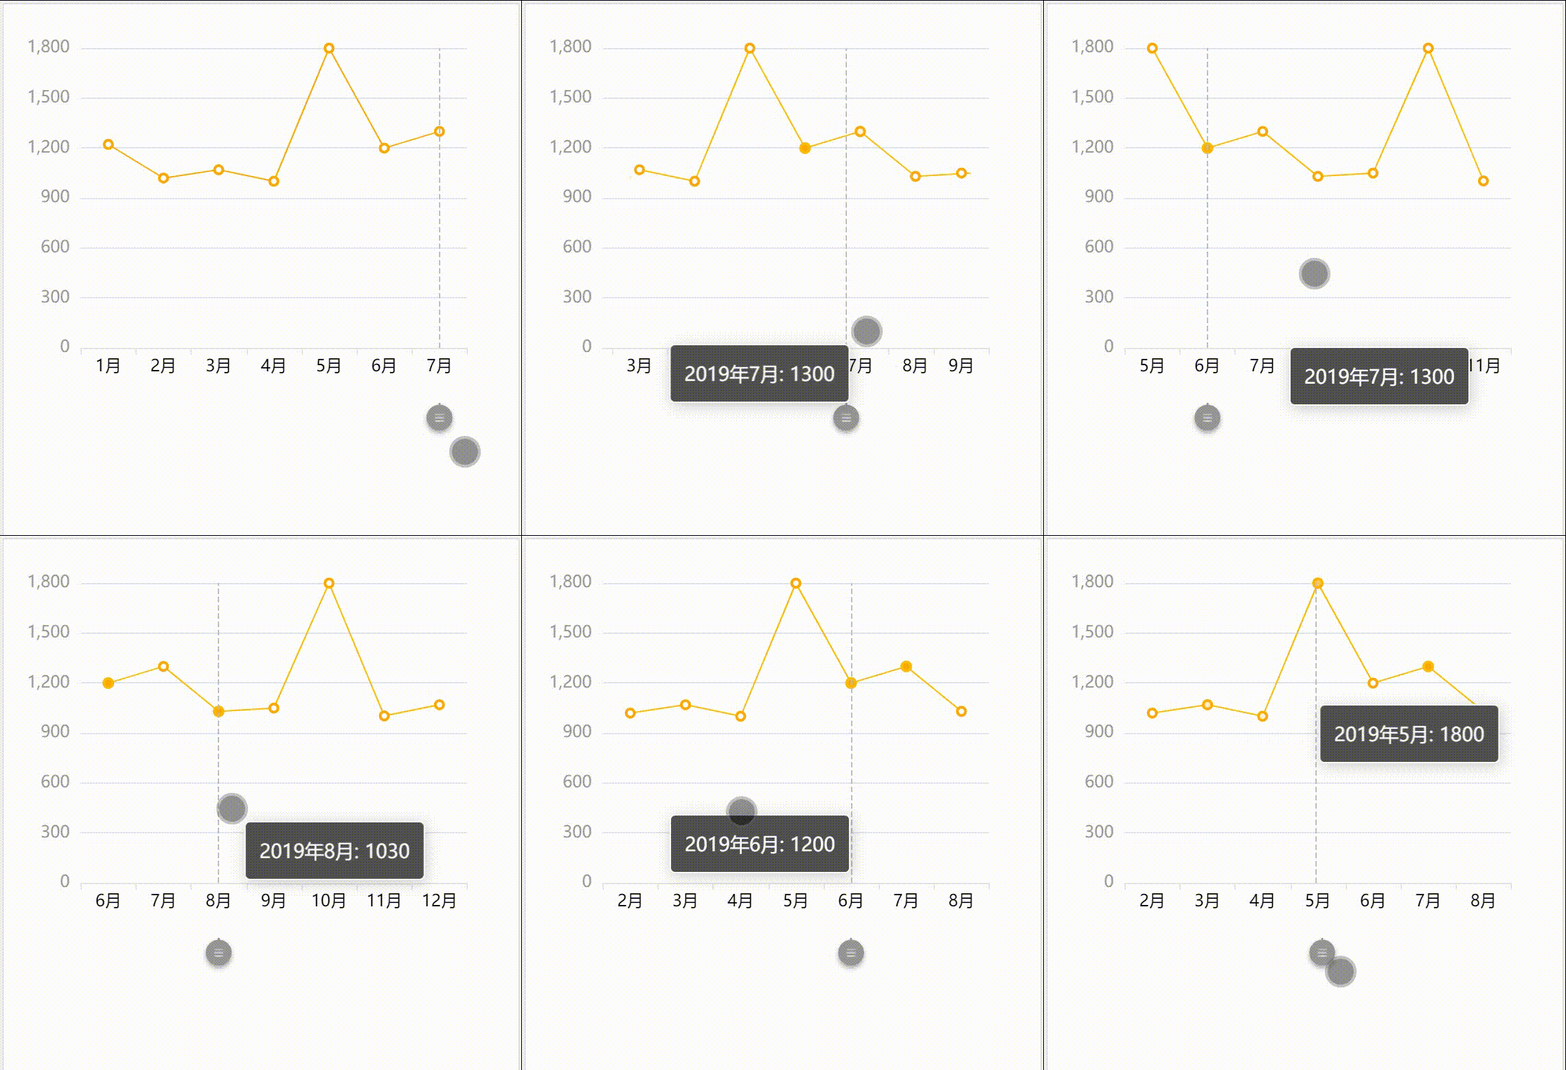
这个是HTML的实例,还没做成组件

<!--
    THIS EXAMPLE WAS DOWNLOADED FROM https://echarts.apache.org/examples/zh/editor.html?c=line-tooltip-touch
-->
<!DOCTYPE html>
<html style="height: 100%">
    <head>
        <meta charset="utf-8">
		  <meta name="viewport" content="initial-scale=1, maximum-scale=1, user-scalable=no, width=device-width">
    </head>
	<style type="text/css">

	</style>
    <body style="height: 560px; margin: 0" class="content">
        <div id="container" style="height: 20rem;"></div>


        <script type="text/javascript" src="https://cdn.jsdelivr.net/npm/echarts@5.3.0/dist/echarts.min.js"></script>
        <!-- Uncomment this line if you want to dataTool extension
        <script type="text/javascript" src="https://cdn.jsdelivr.net/npm/echarts@5.3.0/dist/extension/dataTool.min.js"></script>
        -->
        <!-- Uncomment this line if you want to use gl extension
        <script type="text/javascript" src="https://cdn.jsdelivr.net/npm/echarts-gl@2/dist/echarts-gl.min.js"></script>
        -->
        <!-- Uncomment this line if you want to echarts-stat extension
        <script type="text/javascript" src="https://cdn.jsdelivr.net/npm/echarts-stat@latest/dist/ecStat.min.js"></script>
        -->
        <!-- Uncomment this line if you want to use map
        <script type="text/javascript" src="https://cdn.jsdelivr.net/npm/echarts@5.3.0/map/js/china.js"></script>
        <script type="text/javascript" src="https://cdn.jsdelivr.net/npm/echarts@5.3.0/map/js/world.js"></script>
        -->
        <!-- Uncomment these two lines if you want to use bmap extension
        <script type="text/javascript" src="https://api.map.baidu.com/api?v=2.0&ak=<Your Key Here>"></script>
        <script type="text/javascript" src="https://cdn.jsdelivr.net/npm/echarts@{{version}}/dist/extension/bmap.min.js"></script>
        -->

<script type="text/javascript">
var dom = document.getElementById("container");
var myChart = echarts.init(dom);
var option = {
  //dataZoom-inside 内置型数据区域缩放组件 所谓内置 1平移:在坐标系中滑动拖拽进行数据区域平移。2缩放:PC端:鼠标在坐标系范围内滚轮滚动(MAC触控板类同;移动端:在移动端触屏上,支持两指滑动缩放。
  dataZoom: [
    {
      type: 'inside', //1平移 缩放
      throttle: '50', //设置触发视图刷新的频率。单位为毫秒(ms)。
      minValueSpan: 6, //用于限制窗口大小的最小值,在类目轴上可以设置为 5 表示 5 个类目
      start: 1, //数据窗口范围的起始百分比 范围是:0 ~ 100。表示 0% ~ 100%。
      end: 50, //数据窗口范围的结束百分比。范围是:0 ~ 100。
      zoomLock: true //如果设置为 true 则锁定选择区域的大小,也就是说,只能平移,不能缩放。
    }
  ],
  // 主要用来控制图表四周留白
  grid: {
    left: '15%',
    top: '10%'
  },

  // 提示框组件
  tooltip: {
    trigger: 'axis', //坐标轴触发,主要在柱状图,折线图等会使用类目轴的图表中使用。
    backgroundColor: '#505050', //提示框浮层的背景颜色。
	textStyle:{
		  color: '#ffffff' // 坐标轴线线的颜色。
	},

    // 自定义提示框内容
    formatter: function (params, ticket, callback) {
      var text = params[0].data.date + ': ' + params[0].data.value;
      return text;
    },
	   position: function (point, params, dom, rect, size) {
	       // 固定在顶部
	       return 'top';
	   }

  },
  //直角坐标系 grid 中的 x 轴,
  xAxis: {
    type: 'category', //'category' 类目轴,适用于离散的类目数据,为该类型时必须通过 data 设置类目数据。
    nameTextStyle: {
         fontSize: 30
       },
	// 坐标轴轴线相关设置
    axisLine: {
      lineStyle: {
        color: '#E5E5E5' // 坐标轴线线的颜色。
      }
    },

    // 坐标轴刻度标签(类目,简单说就是x轴上的内容)的相关设置
    axisLabel: {
      //  是否显示坐标刻度标签(这了指是否显示x轴上的月份)
      show: true,
      // 标签文字的颜色
      color: '#000000'
    },

	axisPointer: {
	  //去掉移动的指示线
	  type: 'line',
	  // snap: true,
	  handle: {
	    show: true,
	    color: '#969696',
		size:20
	  },
	},
    //x轴刻度线设置
    axisTick: {
      show: true
    },
    // 类目数据,在类目轴(type: 'category')中有效。
    data: [
      '1月',
      '2月',
      '3月',
      '4月',
      '5月',
      '6月',
      '7月',
      '8月',
      '9月',
      '10月',
      '11月',
      '12月'
    ]
  },
  //直角坐标系 grid 中的 y 轴,
  yAxis: {
    type: 'value', //'value' 数值轴,适用于连续数据。
    // 坐标轴轴线相关设置
    axisLine: {
      show: false //y轴线消失
    },
    // 坐标轴刻度标签(类目,简单说就是x轴上的内容)的相关设置
    axisLabel: {
      show: true,
      // 标签文字的颜色
      color: '#999'
    },
    //y轴刻度线设置
    axisTick: {
      show: false
    },
    splitNumber: 5 //坐标轴的分割段数,需要注意的是这个分割段数只是个预估值,最后实际显示的段数会在这个基础上根据分割后坐标轴刻度显示的易读程度作调整.在类目轴中无效。
  },
  series: [
    {
      type: 'line', //折线图是用折线将各个数据点标志连接起来的图表,用于展现数据的变化趋势。和全局设置type效果一样,表示折线图
      // 系列中的数据内容数组。数组项通常为具体的数据项。
      data: [
        {
          value: 1222,
          date: '2019年1月'
        },
        {
          value: 1020,
          date: '2019年2月'
        },
        {
          value: 1070,
          date: '2019年3月'
        },
        {
          value: 1001,
          date: '2019年4月'
        },
        {
          value: 1800,
          date: '2019年5月'
        },
        {
          value: 1200,
          date: '2019年6月'
        },
        {
          value: 1300,
          date: '2019年7月'
        },
        {
          value: 1030,
          date: '2019年8月'
        },
        {
          value: 1050,
          date: '2019年9月'
        },
        {
          value: 1800,
          date: '2019年10月'
        },
        {
          value: 1003,
          date: '2019年11月'
        },
        {
          value: 1070,
          date: '2019年12月'
        }
      ],
      // 折线条的样式
      lineStyle: {
        color: '#ffaa00',
        width: 1
      },
      // 折线拐点的样式
      itemStyle: {
        normal: {
          // 静止时:
          color: '#ffaa00'
        },
        emphasis: {
          // 鼠标经过时:
          color: '#ffaa00'
        }
      },
      symbol: 'emptyCircle', //拐点样式
      symbolSize: 6 //拐点大小
    }
  ]
};

if (option && typeof option === 'object') {
    myChart.setOption(option);
}

        </script>
    </body>
</html>
晚点做成组件。