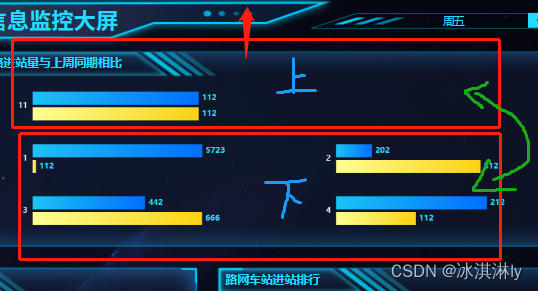
一开始是想用vue-seamless-scroll插件的,后来发现有问题,第二个盒子渲染出来了但是不显示不知道是什么原因(这个插件会复制两个一样的盒子,如图两个蓝色横线)
datav适用于表格滚动,这样带echarts的还不行
我看有的文章是用echarts的zoom什么属性来实现,那样看起来不能无缝,每次最下边的图形都要重新加载,视觉效果不好。

没办法只能自己写了
思路是:写上下两个盒子,循环2次,上边的盒子通过定时器自动改变margin-top实现向上滚动,下边盒子也会跟着上去,等到上边盒子滚动完,将上边盒子放到下边盒子后面同时margin-top改为0,然后继续之前的操作。循环该操作是用变量t来交换2个盒子。
如果父组件传过来的data值发生了变化,要关掉定时器,一切恢复最初的样子。
我的布局是一行有两组数,一个页面能看到的只有6个,在第二个盒子v-if判断一下,data长度小于6就不渲染,代码中也不让滚动。

主要代码:
fun() {
      console.log("data长度", this.data.length);
      if (this.data.length > 6) {
        let box1 = this.$el.querySelector("#box1");
        let box2 = this.$el.querySelector("#box2");
        this.num = 0;
        box1.style.marginTop = "0";
        box2.style.marginTop = "0";
        box1.after(box2); //每次更新数据保证box1在前   box2在后   2个盒子都归0
        console.log("box2在后");
        //计时开始
        this.timesss = setInterval(() => {
          console.log("计时滚动");

          let boxHeight = Math.ceil(this.data.length / 2) * 80; //行数 * 80=一个盒子的高度
          console.log("一个盒子的高度", boxHeight);

          if (this.num == boxHeight) {//上边的盒子滚完了
            console.log("一个盒子结束了");

            box2.after(box1); //将上边的盒子放到下边盒子后
            box1.style.marginTop = "0"; //上边的盒子一切归0
            this.num = 0;

            let t = box1; //用变量t来交换2个盒子
            box1 = box2;
            box2 = t;
          }
          this.num += 80; //每一行的高度为80 然后累加
          box1.style.marginTop = "-" + this.num + "px"; //将累加后的值赋给上边的盒子 实现滚动
        }, 2000);
      }
    }
整个子组件页面代码
<template>
  <div class="box" ref="con1">
    <ul class="ul-scoll" id="box1">
      <li
        class="li-item"
        v-for="(item, index) in data"
        :key="index"
        ref="box1"
      ></li>
    </ul>
    <ul class="ul-scoll" id="box2" v-if="data.length > 0">
      <li class="li-item" v-for="(item, i) in data" :key="i" ref="box2"></li>
    </ul>
  </div>
</template>

<script>

export default {
  name: "",
  components: {},
  props: {
    data: Array,
  },
  watch: {
    data: {
      //deep: true,
      immediate: true,
      handler(newVal, oldVal) {
        if (newVal) {
          this.$nextTick(() => {
            this.data.forEach((item, index) => {
              this.drawChart(this.$refs.box1[index], newVal[index]);
              if (this.data.length > 6) {
                this.drawChart(this.$refs.box2[index], newVal[index]);
                clearInterval(this.timesss);
                this.fun();
              }
            });
          });
        }
      },
    },
  },
  data() {
    return {
      myChart: "",
      num: 0,
      timesss: null,
    };
  },
  methods: {
    drawChart(dom, data) {
      this.myChart = this.$Echarts.init(dom);
      this.myChart.clear();
      this.myChart.resize();

      this.myChart.setOption({
        grid: {
          left: "20%",
          right: "20%",
        },
        yAxis: {
          type: "category",
          data: data.title,
          axisLine: {
            //y轴
            show: false,
            lineStyle: {
              color: "#fff",
            },
          },
          axisTick: {
            //y轴刻度线
            show: false,
          },
          splitLine: {
            //网格线
            show: false,
          },
        },
        xAxis: [
          {
            show: false,
            type: "value",
            name: "销量(kg)",
            splitLine: {
              show: false,
            },
          },
        ],
        series: [
          {
            type: "bar",
            name: "2015",
            data: data.data[0].value,
            label: {
              show: true, //开启显示
              position: "right", //在上方显示

              //数值样式
              color: "#23DCFD",
              fontSize: 12,
              fontWeight: 600,
            },
            itemStyle: {
              //柱形图圆角,鼠标移上去效果,如果只是一个数字则说明四个参数全部设置为那么多
              //柱形图圆角,初始化效果
              borderRadius: [0, 0, 0, 0],
              color: new this.$Echarts.graphic.LinearGradient(
                0,
                0,
                1,
                0,
                [
                  {
                    offset: 0,
                    color: "#1CC3F5", // 0% 处的颜色
                  },
                  {
                    offset: 1,
                    color: "#006FFF", // 100% 处的颜色
                  },
                ],
                false
              ),
            },
          },
          {
            type: "bar",
            name: "2016",
            data: data.data[1].value,
            label: {
              show: true, //开启显
              position: "right", //在上方显示
              //数值样式
              color: "#23DCFD",
              fontSize: 12,
              fontWeight: 600,
            },
            itemStyle: {
              //柱形图圆角,鼠标移上去效果,如果只是一个数字则说明四个参数全部设置为那么多
              //柱形图圆角,初始化效果
              borderRadius: [0, 0, 0, 0],
              color: new this.$Echarts.graphic.LinearGradient(
                0,
                0,
                1,
                0,
                [
                  {
                    offset: 0,
                    color: "#FFFE95", // 0% 处的颜色
                  },
                  {
                    offset: 1,
                    color: "#FBD212", // 100% 处的颜色
                  },
                ],
                false
              ),
            },
          },
        ],
      });
    },
    fun() {
      console.log("data长度", this.data.length);
      if (this.data.length > 6) {
        let box1 = this.$el.querySelector("#box1");
        let box2 = this.$el.querySelector("#box2");
        this.num = 0;
        box1.style.marginTop = "0";
        box2.style.marginTop = "0";
        box1.after(box2); //每次更新数据保证box1在前   box2在后   2个盒子都归0
        console.log("box2在后");
        //计时开始
        this.timesss = setInterval(() => {
          console.log("计时滚动");

          let boxHeight = Math.ceil(this.data.length / 2) * 80; //行数 * 80=一个盒子的高度
          console.log("一个盒子的高度", boxHeight);

          if (this.num == boxHeight) {//上边的盒子滚完了
            console.log("一个盒子结束了");

            box2.after(box1); //将上边的盒子放到下边盒子后
            box1.style.marginTop = "0"; //上边的盒子一切归0
            this.num = 0;

            let t = box1; //用变量t来交换2个盒子
            box1 = box2;
            box2 = t;
          }
          this.num += 80; //每一行的高度为80 然后累加
          box1.style.marginTop = "-" + this.num + "px"; //将累加后的值赋给上边的盒子 实现滚动
        }, 2000);
      }
    },
  },
  mounted() {},
  beforeDestory() {
    clearInterval(this.timesss);
  },
};
</script>

<style scoped lang="scss">
.ul-scoll {
  width: 100%;
  // height: auto;
  display: flex;
  flex-wrap: wrap;
  transition: 0.3s;
  li {
    width: 50%;
    padding: 5px;
    height: 80px;
  }
}
</style>