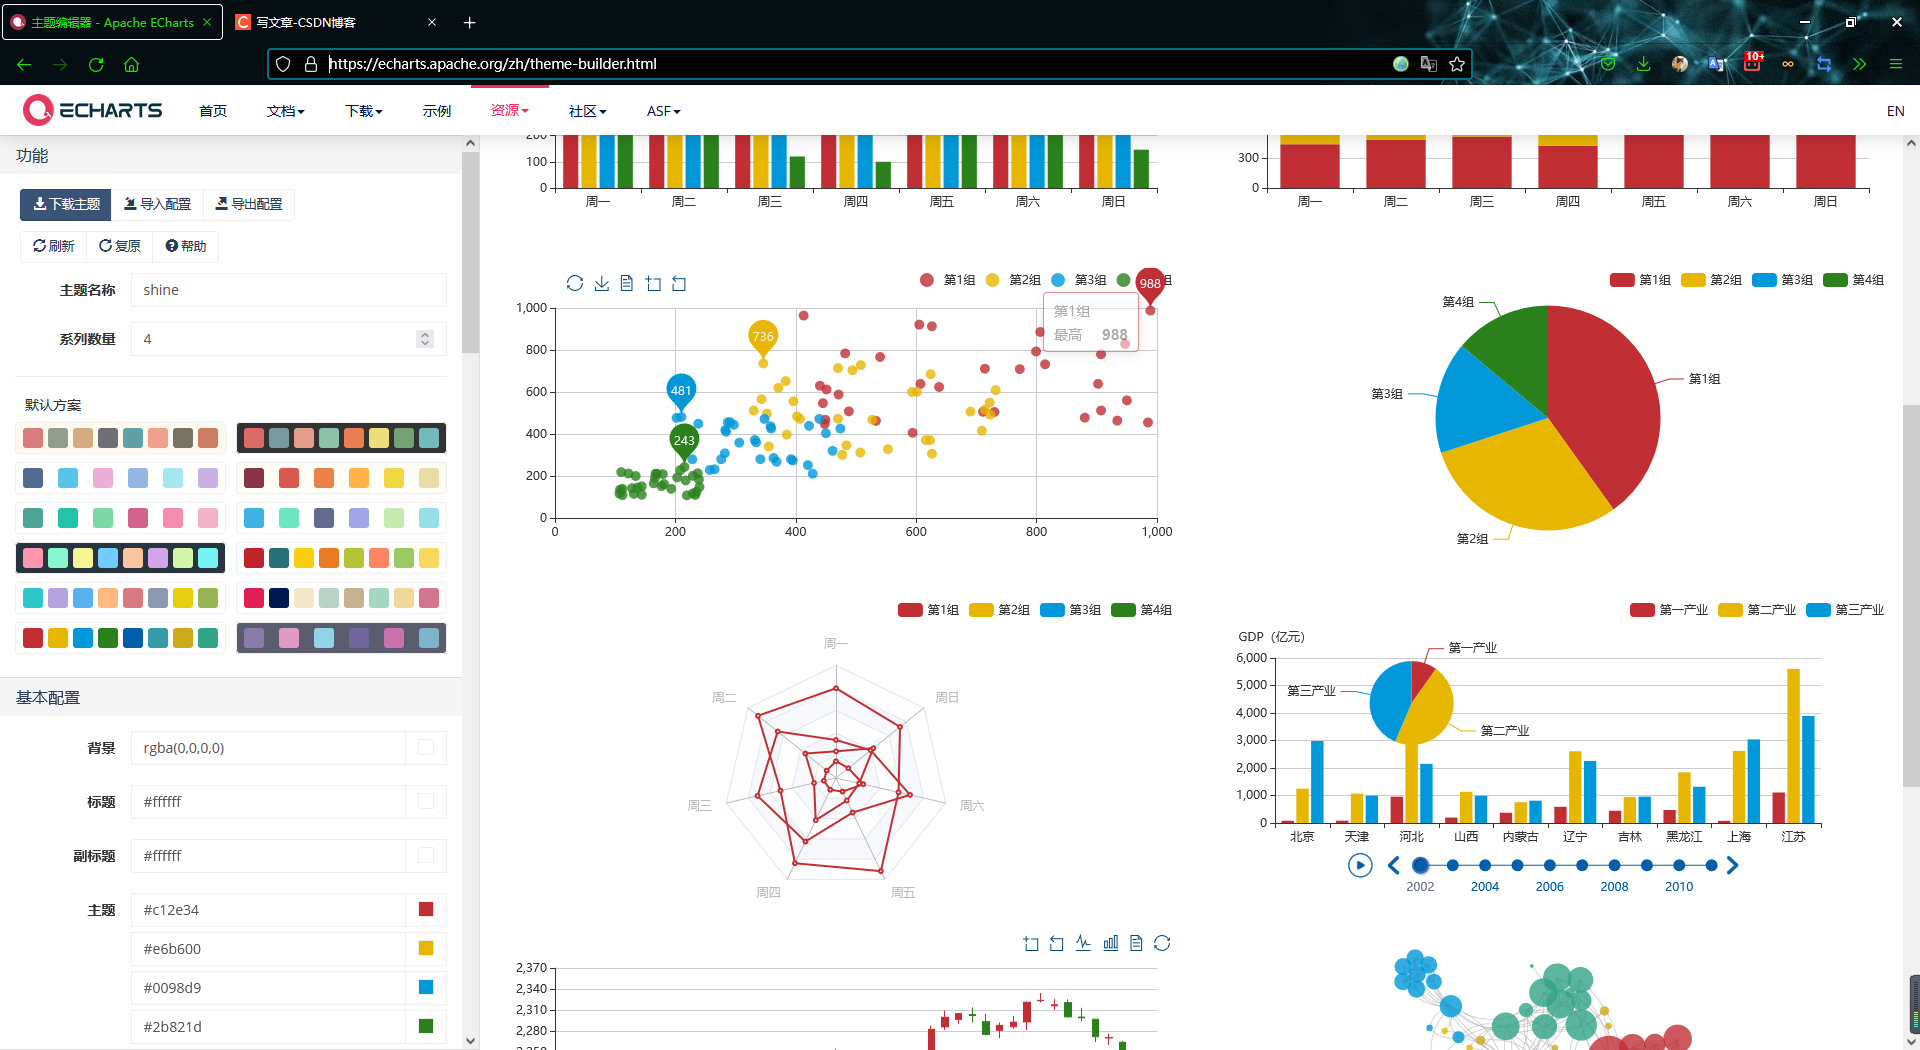
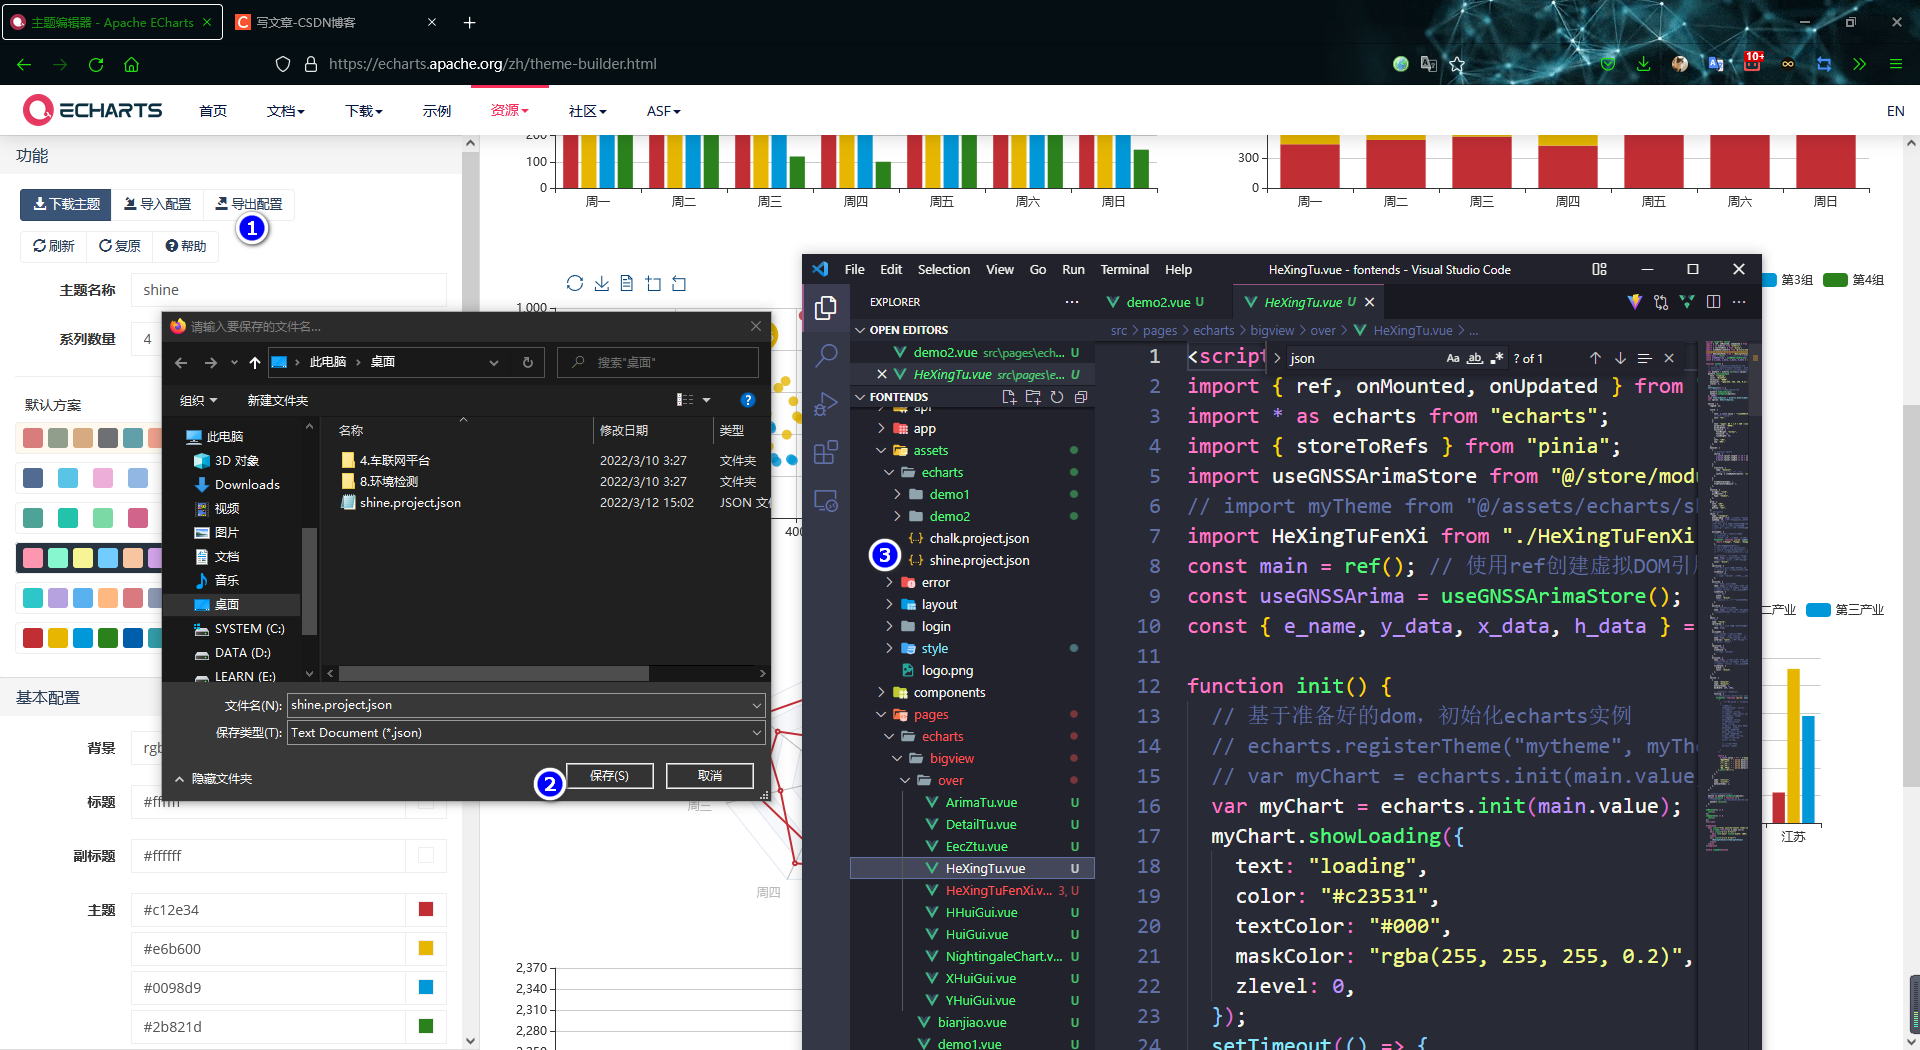
配置

- 配置完成后点击,导出配置,一般为
json文件,然后放置在Vue项目中assets中的自定义目录

使用
- 导入
import myTheme from "@/assets/echarts/shine.project.json";
- 使用
echarts.registerTheme("mytheme", myTheme.theme);
var myChart = echarts.init(main.value, "mytheme");
- 完整示例:数据是从
pinia中获取的
<script lang="ts" setup>
import { ref, onMounted, onUpdated } from "vue";
import * as echarts from "echarts";
import { storeToRefs } from "pinia";
import useGNSSArimaStore from "@/store/modules/analyse/useGNSSArimaStore";
// import myTheme from "@/assets/echarts/shine.project.json";
import HeXingTuFenXi from "./HeXingTuFenXi.vue";
const main = ref(); // 使用ref创建虚拟DOM引用,使用时用main.value
const useGNSSArima = useGNSSArimaStore();
const { e_name, y_data, x_data, h_data } = storeToRefs(useGNSSArima);

function init() {
  // 基于准备好的dom,初始化echarts实例
  // echarts.registerTheme("mytheme", myTheme.theme);
  // var myChart = echarts.init(main.value, "mytheme");
  var myChart = echarts.init(main.value);
  myChart.showLoading({
    text: "loading",
    color: "#c23531",
    textColor: "#000",
    maskColor: "rgba(255, 255, 255, 0.2)",
    zlevel: 0,
  });
  setTimeout(() => {
    // setOption前隐藏loading事件
    myChart.hideLoading();
    myChart.setOption(option);
  }, 1000);
  type EChartsOption = echarts.EChartsOption;
  var option: EChartsOption;

  option = {
    legend: {},

    title: [
      {
        text: e_name?.value + "-近2周数据分布情况",
        // left: "center",
        left: "5%",
      },
      {
        text: "upper: Q3 + 1.5 * IQR \nlower: Q1 - 1.5 * IQR",
        borderColor: "#999",
        borderWidth: 1,
        textStyle: {
          fontWeight: "normal",
          fontSize: 14,
          lineHeight: 20,
        },
        left: "10%",
        top: "90%",
      },
    ],
    dataset: [
      {
        // prettier-ignore
        source: [
          x_data?.value?.length == 14 ? [] : x_data?.value?.slice(-14,) as any,
          y_data?.value?.length == 14 ? [] : y_data?.value?.slice(-14,) as any,
          h_data?.value?.length == 14 ? [] : h_data?.value?.slice(-14,) as any,
        ],
      },
      {
        transform: {
          type: "boxplot",
          // config: ["X", "Y", "Z"],
          config: { itemNameFormatter: "{value}" },
        },
      },
      {
        fromDatasetIndex: 1,
        fromTransformResult: 1,
      },
    ],
    tooltip: {
      trigger: "item",
      axisPointer: {
        type: "shadow",
      },
    },
    grid: {
      left: "10%",
      right: "10%",
      bottom: "15%",
    },
    // @ts-ignore
    xAxis: {
      type: "category",
      boundaryGap: true, //类目轴中 boundaryGap 可以配置为 true 和 false。默认为 true,这时候刻度只是作为分隔线,标签和数据点都会在两个刻度之间的带(band)中间。
      nameGap: 30, //坐标轴名称与轴线之间的距离。
      // splitArea: {
      //坐标轴在 grid 区域中的分隔区域,默认不显示。
      //show: true, //是否显示分隔区域
      //interval: 'auto', //坐标轴分隔区域的显示间隔,在类目轴中有效
      // },
      axisLabel: {
        //坐标轴刻度标签的相关设置。
        // interale: 0,
        // rotate: -40, //设置日期显示样式(倾斜度)
        formatter: function (value: number) {
          return ["X方向", "Y方向", "Z方向"][value];
        },
        //在这里写你需要的时间格式
        // var t_date = new Date(value);
        // return [t_date.getFullYear(), t_date.getMonth() + 1, t_date.getDate()].join('-')
        // + " " + [t_date.getHours(), t_date.getMinutes()].join(':'); 时分

        // formatter: '{["X方向", "Y方向", "Z方向"][value]}', // 使用字符串模板,模板变量为刻度默认标签 {value}
        show: true, //是否显示刻度标签。
        //interval: 'auto', //坐标轴刻度标签的显示间隔,在类目轴中有效。
        color: "black",
      },
      splitLine: {
        //坐标轴在 grid 区域中的分隔线。
        // show: true, //是否显示分隔线。默认数值轴显示,类目轴不显示。
        lineStyle: {
          //分隔线样式
          // type: "dashed", //分隔线线的类型。
        },
      },
      axisLine: {
        //坐标轴轴线相关设置。
        show: true, //是否显示坐标轴轴线。
        //onZero:false,//X 轴或者 Y 轴的轴线是否在另一个轴的 0 刻度上,只有在另一个轴为数值轴且包含 0 刻度时有效。
        //symbol:'arrow', //轴线两边的箭头, 默认不显示箭头,即 'none'
        lineStyle: {
          //轴线样式
          width: 1,
          color: "black",
          //opacity: 1, //图形透明度。支持从 0 到 1 的数字,为 0 时不绘制该图形。
        },
      },
      axisTick: {
        //坐标轴刻度相关设置。
        show: true, //是否显示坐标轴刻度。
        //alignWithLabel: true,//类目轴中在 boundaryGap 为 true 的时候有效,可以保证刻度线和标签对齐,default: false
      },
    },
    yAxis: {
      //y轴
      type: "value",
      splitArea: {
        //坐标轴在 grid 区域中的分隔区域,默认不显示。
        show: true,
      },
      axisLabel: {
        //坐标轴刻度标签的相关设置。
        //formatter: 'expr {value}',  // 使用字符串模板,模板变量为刻度默认标签 {value}
        show: true, //是否显示刻度标签。
        interval: "auto", //坐标轴刻度标签的显示间隔,在类目轴中有效。
        // color: "black",
      },
      splitLine: {
        show: true,
        lineStyle: {
          // type: "dashed",
        },
      },
      axisLine: {
        show: true, //是否显示坐标轴轴线。
        //onZero:false,//X 轴或者 Y 轴的轴线是否在另一个轴的 0 刻度上,只有在另一个轴为数值轴且包含 0 刻度时有效。
        // symbol: "arrow", //轴线两边的箭头
        lineStyle: {
          width: 1,
          color: "black",
        },
      },
    },
    series: [
      {
        name: "boxplot",
        type: "boxplot",
        datasetIndex: 1,
        boxWidth: [90, 100],

        // itemStyle: "emphasis",
        tooltip: {
          //注意:series.tooltip 仅在 tooltip.trigger 为 'item' 时有效。
          formatter: function (param: any) {
            /*
              第一个参数 param 是 formatter 需要的数据集。 格式如下:
              {
                //组件类型
                componentType: 'series',
                // 系列类型
                seriesType: string,
                // 系列在传入的 option.series 中的 index
                seriesIndex: number,
                // 系列名称
                seriesName: string,
                // 数据名,类目名
                name: string,
                // 数据在传入的 data 数组中的 index
                dataIndex: number,
                // 处理过的数据项
                data: Object | Array,
                // 处理过的数据项
                value: number | Array,
                // 数据图形的颜色
                color: string,

                // 饼图的百分比
                percent: number,

              }
            */

            return [
              e_name?.value + "-" + ["X方向", "Y方向", "Z方向"][param.name],
              "最高限度: " + param.data[5],
              "上四分位: " + param.data[4],
              "中四分位: " + param.data[3],
              "下四分位: " + param.data[2],
              "最低限度: " + param.data[1],
            ].join("<br/>");
          },
        },
      },
      {
        name: "outlier",
        type: "scatter",
        datasetIndex: 2,
      },
    ],
  };

  // myChart.showLoading();
  option && myChart.setOption(option);
  window.onresize = function () {
    //自适应大小, 不用的话不会自适应大小。
    myChart.resize();
  };
}

onMounted(() => {
  init();
});
onUpdated(() => {
  init();
});
</script>

<template>
  <div class="flex justify-center items-center w-full h-full">
    <p v-show="false">{{ e_name }}</p>
    <div class="w-1/2 h-full">
      <div ref="main" style="width: 100%; height: 100%"></div>
    </div>
    <div class="w-1/2 h-full">
      <HeXingTuFenXi></HeXingTuFenXi>
    </div>
  </div>
</template>

<style scoped></style>