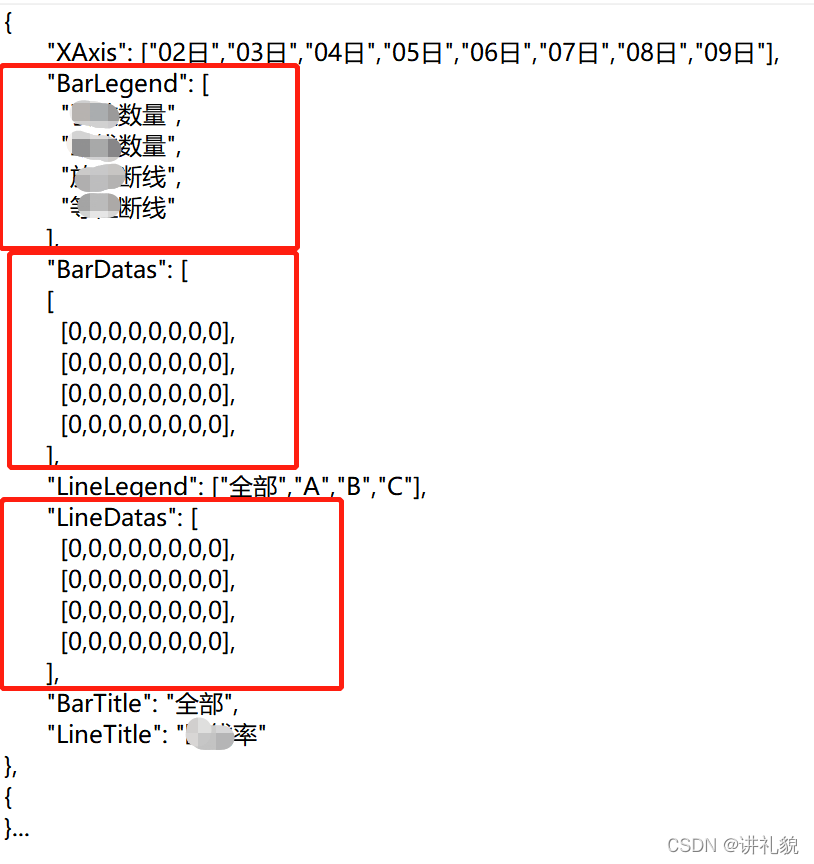
当返回的数据格式是单个数组的时候,可以直接循环datas传入echarts组件进行复用。

处理方式:tableData是接口的datas对象数据。
<el-scrollbar ref="scrollbar" style="height:100%; width:100%;">
        <el-row type="flex" justify="space-between" style="flex-wrap:wrap;height:30%">
          <el-col v-for="(item, index) in tableData" :key="index" :span="11" style="height:100%;">
            <TrendBar :xAxis="item.XAxis" :barDatas="item.BarDatas" :title="item.BarTitle" :barLegend="queryModel.title" :keepDecimal="1" />
          </el-col>
        </el-row>
</el-scrollbar>
但是如果是以下格式,返回来的是数组嵌套数组的格式,需要把 echarts组件里的series: (function() {})设置成一个方法进行数据解析。

解析数据的方法:forEach的方法, const serie = [];
用push方法,最后return serie;
series: (function() {
            const serie = [];
            barDatas.forEach((element, index) => {
              serie.push({
                data: barDatas[index],
                name: barLegend[index],
                type: 'bar',
                barWidth: remScale(0.07), // 柱图宽度
                barGap: remScale(0.018),
                itemStyle: {
                  normal: {
                    color: colorArr[index],
                    label: {
                      show: true, // 开启显示
                      position: 'top', // 在上方显示
                      // 数值样式
                      color: '#fff',
                      fontSize: remScale(0.1),
                      formatter: function(datas) {
                        return datas.value
                      }
                    }
                  }
                }
              });
            });
           return serie;
   })
图例有四个,数据是四个数组,说明横轴,一个刻度有4条数据。如下:
