一、用python进行数据提取
import sqlite3

from flask import Flask, render_template

app = Flask(__name__)


@app.route('/')
def hello_world():  # put application's code here
    score = []
    num = []
    con = sqlite3.connect("movie.db")
    print("成功打开数据库")
    cur = con.cursor()
    sql = "select score,count(score) from movie25 group by score"
    data = cur.execute(sql)
    for item in data:
        score.append(item[0])
        num.append(item[1])
    cur.close()

    return render_template("score.html", score =score, num =num)


if __name__ == '__main__':
    app.run()
二、用图表展示
<!DOCTYPE html>
<html lang="en">
<head>
    <meta charset="UTF-8">
    <script src="/static/assets/js/echart.min.js"></script>
    <title>Title</title>
</head>
<body>

  <!-- 为 ECharts 准备一个定义了宽高的 DOM -->
  <div id="main" style="width:1000px;height:600px;"></div>
    <script type="text/javascript">
      // 基于准备好的dom,初始化echarts实例
      var myChart = echarts.init(document.getElementById('main'));

      // 指定图表的配置项和数据

      var option = {
        title: {
          text: '电影评分统计表',
          left: 'center'
        },
        tooltip: {
            trigger: 'axis',
            axisPointer: {
                type: 'shadow'
            }
        },
        legend: {
          data: ['销量']
        },
        grid: {
            left: '3%',
            right: '4%',
            bottom: '3%',
            containLabel: true
        },
        xAxis: {
          type: 'category',
          data: {{ score }}
        },
        yAxis: {
            type: 'value'
        },
        series: [
          {
            data: {{ num }},
            type: 'bar',
            barWidth: '60%'
          }
        ]
      };


      // 使用刚指定的配置项和数据显示图表。
      myChart.setOption(option);
    </script>

</body>
</html>
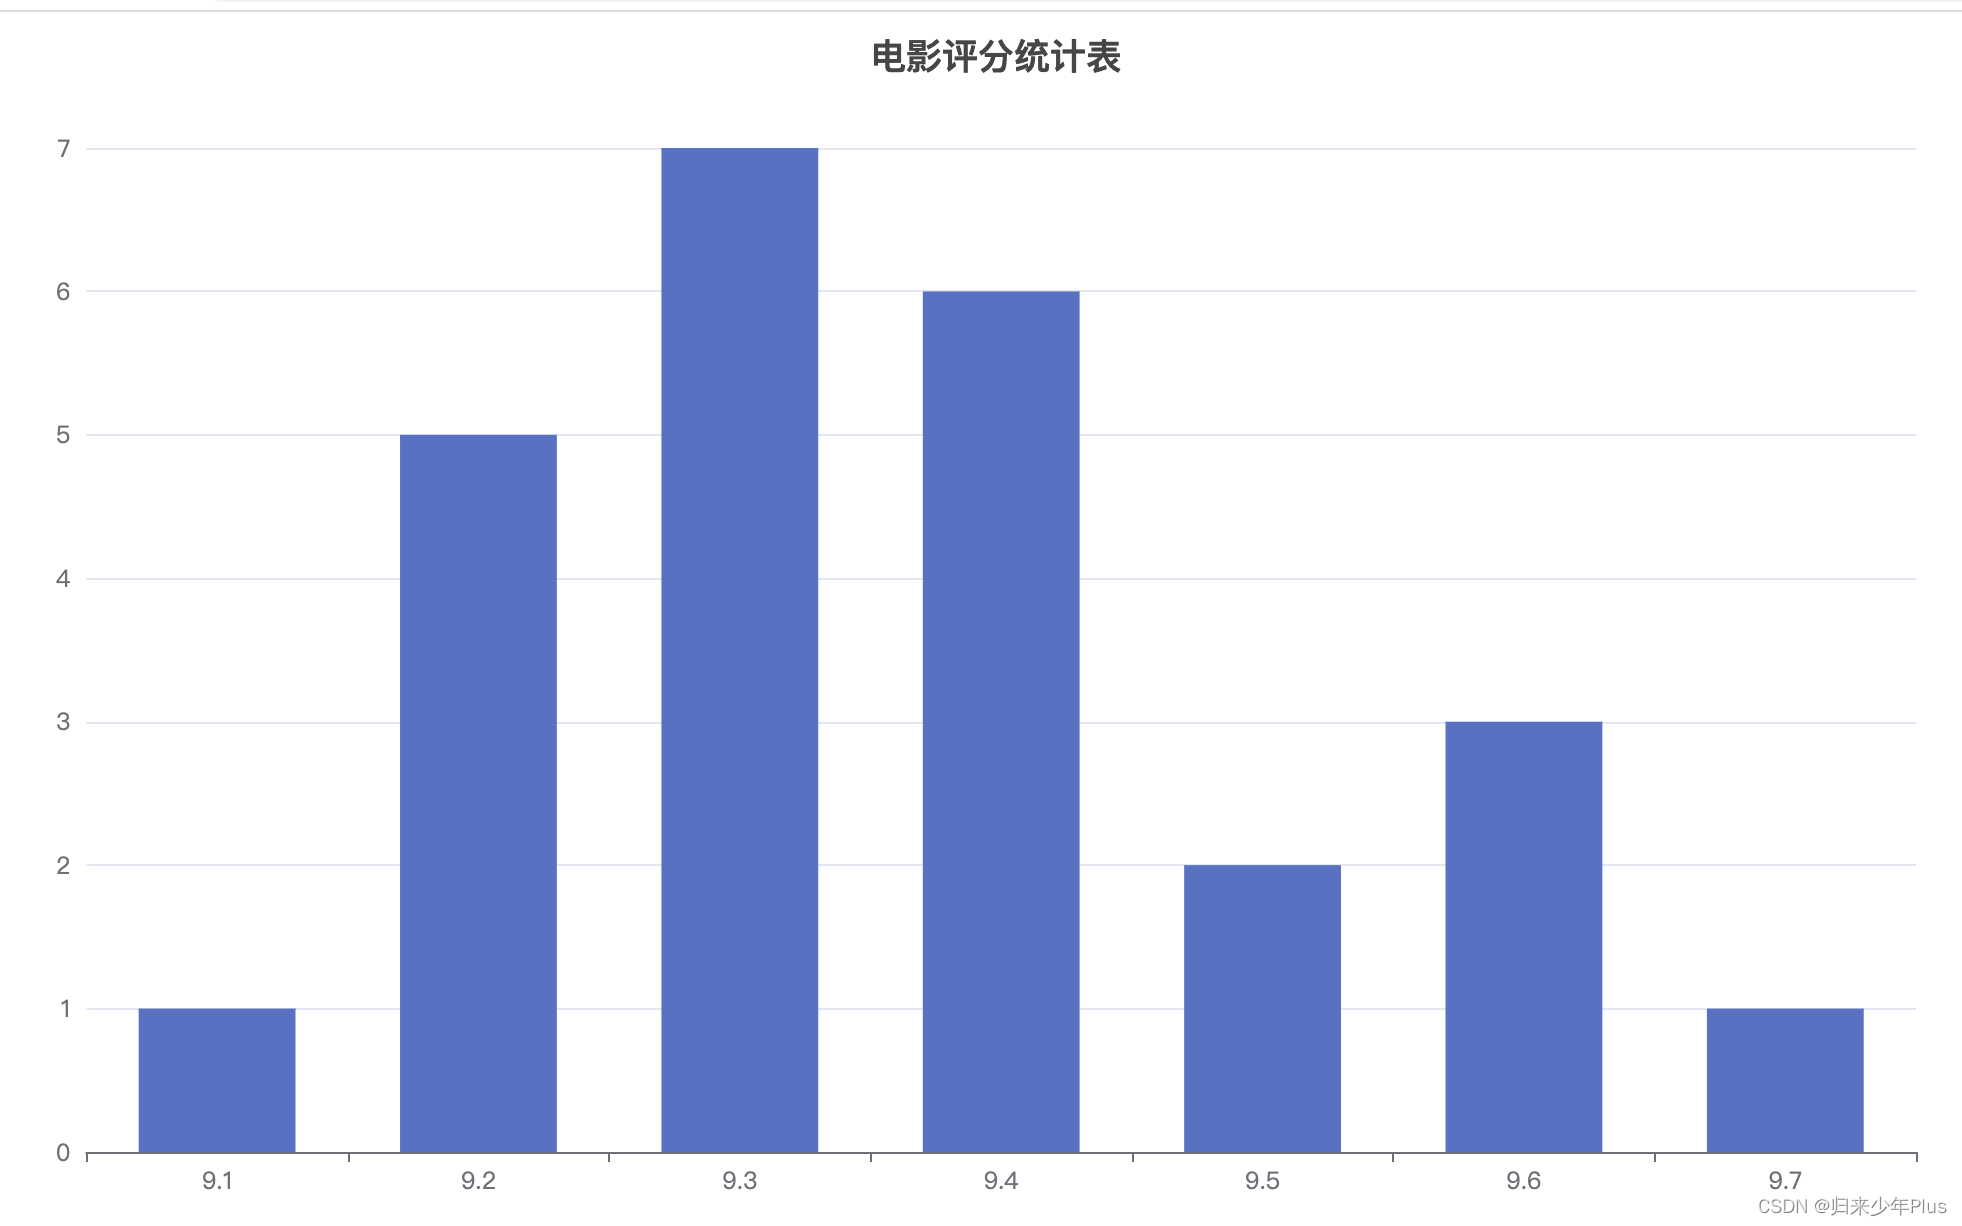
最后的成果如下:

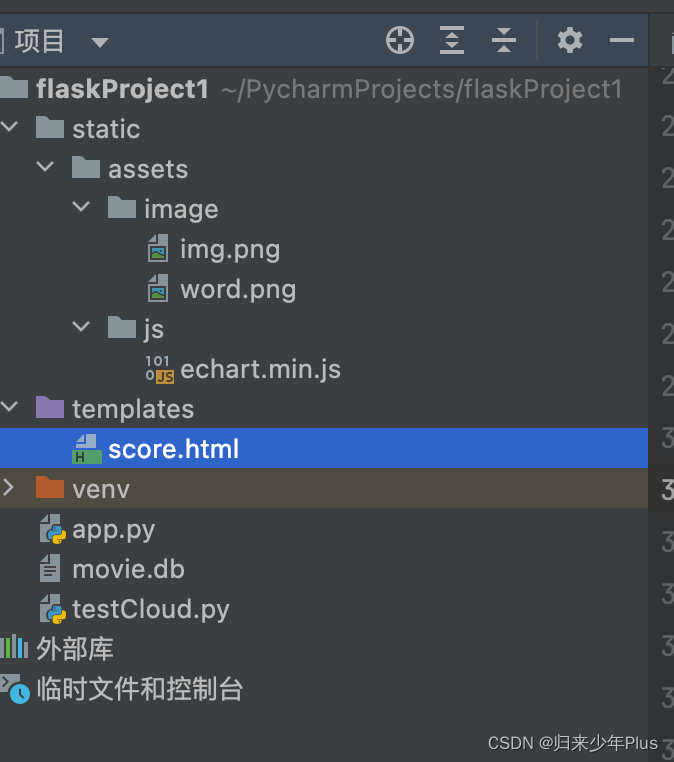
代码目录如下:
