<%@ page language="java"?contentType="text/html; charset=UTF-8"?pageEncoding="UTF-8"%>

<%

????String path =?request.getContextPath();

%>

<!DOCTYPE?HTML>

<html?xmlns="http://www.w3.org/1999/xhtml">

<head>

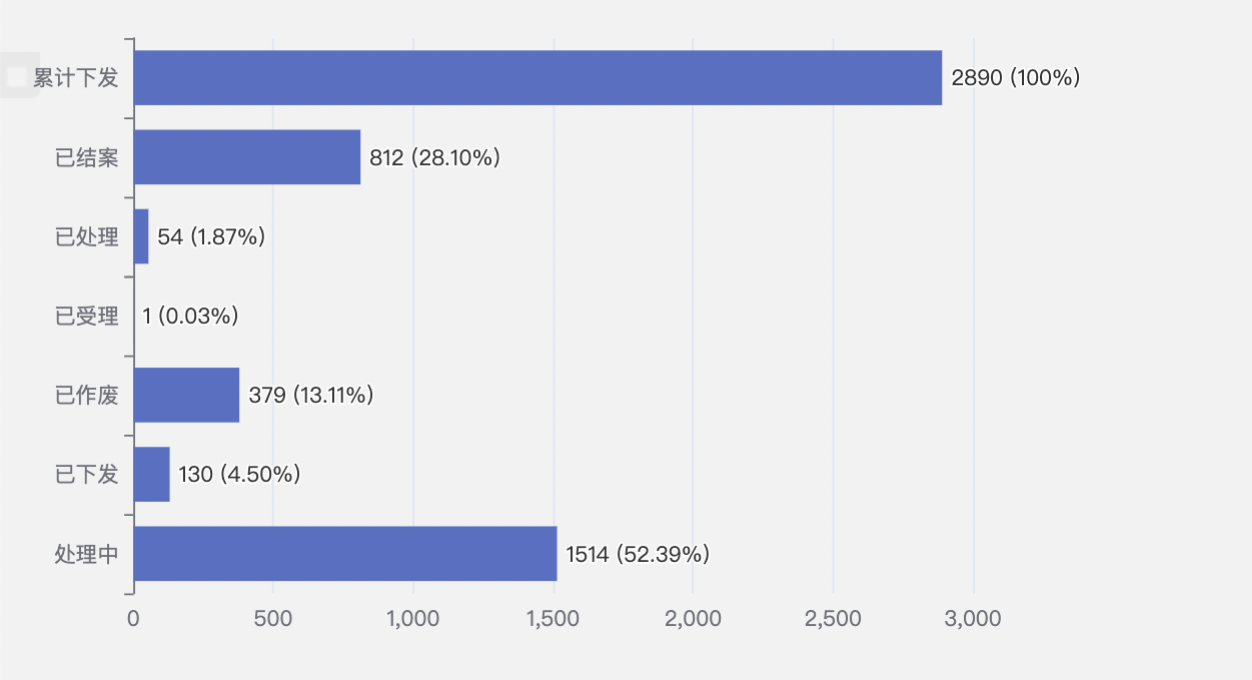
????<title>统计</title>

????<jsp:include?page="/page/hcbh/api/module.jsp"></jsp:include>

????<script?type="text/javascript"?src="<%=path %>/page/hcbh/api/taskpush/stats/echarts-5.3.1.js"></script>

????<script type="text/javascript"?src="<%=path %>/page/hcbh/api/taskpush/stats/zhzx.js"></script>

</head>

<body>

????<div id="status"?style="width: 600px;height:400px;"></div>

</body>
$(document).ready(function() {

????stats_status();

});


/**

?* 按状态统计

?*/

function?stats_status(){

????var?url =?"/gds/query/list.do";

????var?data = {

????????"c":"stats_type"

????};

????var?res =??ajaxData(url,data);


????// 基于准备好的dom,初始化echarts实例

????var?myChart =?echarts.init(document.getElementById('status'));


????if(res.length ===?0){

????????//无数据展示

????????myChart.setOption({

????????????title: {

????????????????text:?'暂无数据',

????????????????x:?'center',

????????????????y:?'center',

????????????????textStyle: {

????????????????????color:?'#65ABE7',

????????????????????fontWeight:?'normal',

????????????????????fontSize:?16

????????????????}

????????????}

????????});

????}else{

????????var?dataAxis = [];?//X轴name

????????var?dataYis = [];?//y轴值

????????var?dataPercent = [];//百分比


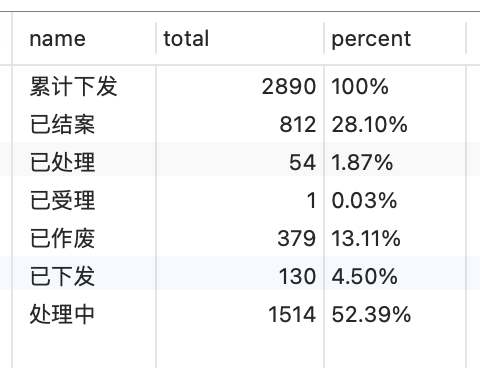
????????for?(var?i in?res) {

????????????dataAxis.push(res[i].name);

????????????dataYis.push(res[i].total);

????????????dataPercent.push(res[i].percent)

????????}


????????//绘制图表

????????myChart.setOption({

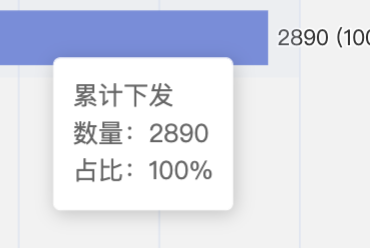
????????????tooltip: {

????????????????trigger:?'axis',

????????????????axisPointer: {

????????????????????type:?'shadow'

????????????????},

????????????????formatter:function(params){

????????????????????return?params[0].name +?"<br>数量:"?+params[0].value +?"<br>占比:"?+?dataPercent[params[0].dataIndex]

????????????????}

????????????},

????????????grid: {

????????????????left:?'3%',

????????????????// right: '4%',

????????????????bottom:?'3%',

????????????????containLabel:?true

????????????},

????????????xAxis: {

????????????????type:?'value',

????????????????boundaryGap: [0,?0.01]

????????????},

????????????yAxis: {

????????????????type:?'category',

????????????????data:?dataAxis

????????????},

????????????series: [

????????????????{

????????????????????name:?'案件状态',

????????????????????type:?'bar',

????????????????????data:?dataYis,

????????????????????label:{

????????????????????????show:true,

????????????????????????position:'right',

????????????????????????formatter:function(params){

????????????????????????????return?params.value +?" ("?+?dataPercent[params.dataIndex]+")";

????????????????????????}

????????????????????}

????????????????}

????????????]

????????});

????}

????window.onresize =?myChart.resize;

}


