let category = [];
let lineData = [40000,  30000, 10000, 23000,  9000, 15000, 23000, 52000, 21000, 10000, 41000];
for (let i = 0; i < 11; i++) {
  category.push('地市' + i);
}
// option
option = {
  backgroundColor: '#0f375f',
  tooltip: {
    trigger: 'axis',
    axisPointer: {
      type: 'shadow'
    }
  },
  legend: {
    data: ['完成人数', '完成率'],
    right: '1%',
    textStyle: {
      color: '#ccc'
    }
  },
  xAxis: {
    data: category,
    axisLine: {
      lineStyle: {
        color: '#ccc'
      }
    }
  },
  yAxis: [
    {
      type: 'value',
      name: '完成人数',
      position: 'left',
      splitLine: { show: false },
      // alignTicks: true,
      axisLine: {
        // show: true,
        lineStyle: {
          color: '#ccc'
        }
      },
      axisLabel: {
        formatter: '{value} '
        // formatter: '{value} 人'
      }
    },
    {
      type: 'value',
      name: '完成率',
      position: 'right',
      splitLine: { show: false },
      // alignTicks: true,
      axisLine: {
        // show: true,
        lineStyle: {
          color: '#fff'
        }
      },
      axisLabel: {
        formatter: function (value, index) {
          var nummax = 1;
          for(var i = 0;i<lineData.length;i++){
            if(nummax < value){
              nummax = lineData[i];
            }else{
              nummax = nummax;
            }
          }
          return new Number(value/60000).toFixed(2)*100 + '%';
        }
      }
    }
  ],
  series: [
    {
      name: '完成率',
      type: 'line',
      symbol: 'none',
      smooth: 0.6,
      // smooth: true,
      showAllSymbol: true,
      // symbol: 'emptyCircle',
      symbolSize: 15,
      data: lineData,
      yAxisIndex: 0,
      lineStyle: {
        color: new echarts.graphic.LinearGradient(0, 0, 0, 1, [
          { offset: 0, color: '#97b5f7' },
          { offset: 1, color: '#cccccc' }
        ]),
        width: 5,
      },
    },
    {
      name: '完成人数',
      type: 'bar',
      barWidth: 15,
      yAxisIndex: 1,
      itemStyle: {
        borderRadius: 10,
        color: new echarts.graphic.LinearGradient(0, 0, 0, 1, [
          { offset: 0, color: '#6cc183' },
          // { offset: 0.2, color: 'rgba(20,200,212,0.2)' },
          { offset: 1, color: '#00b9e9' }
        ])
      },
      data: lineData
    }
  ]
};
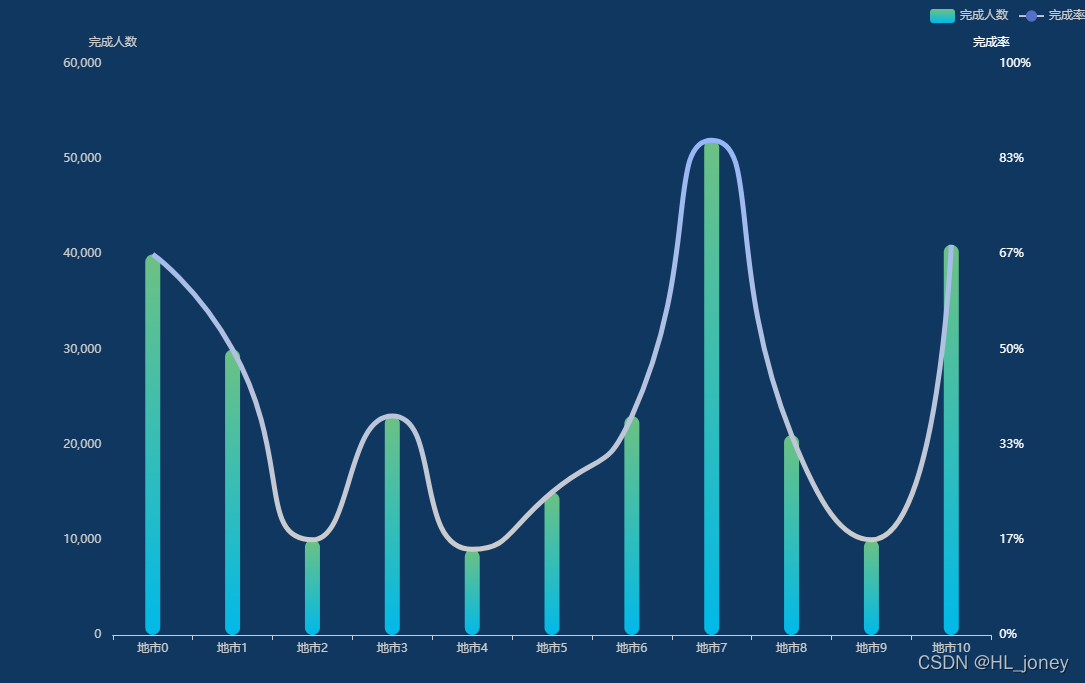
效果如下图所示:

?
?
?