引入
1、安装依赖
npm install gojs --save
我的项目太大了
安装了好久还总报错
but如果你在package.json查看一下版本号
只要有版本号就是安装上了!

2、main.js引入
import gojs from 'gojs'
Vue.prototype.go = gojs
使用
查到很多文章说需要在使用的页面中的< script >区域引入(但我不能,会报错
import go from "gojs";
const $ = go.GraphObject.make;
所以我直接把go.GraphObject.make写上了(所以以下我用的都是全称来的
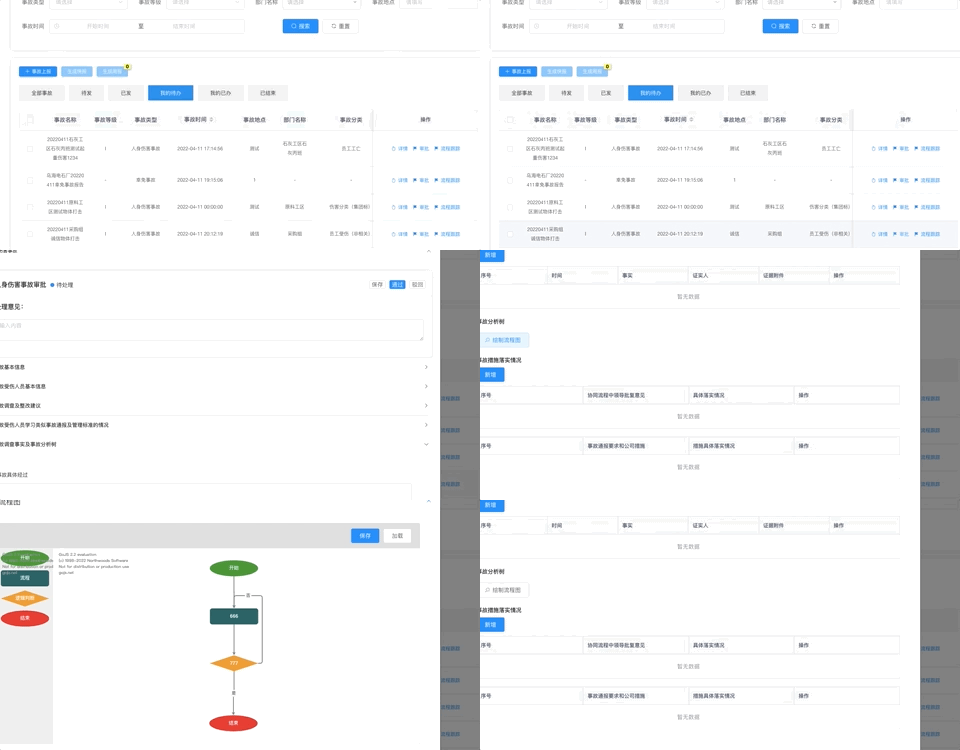
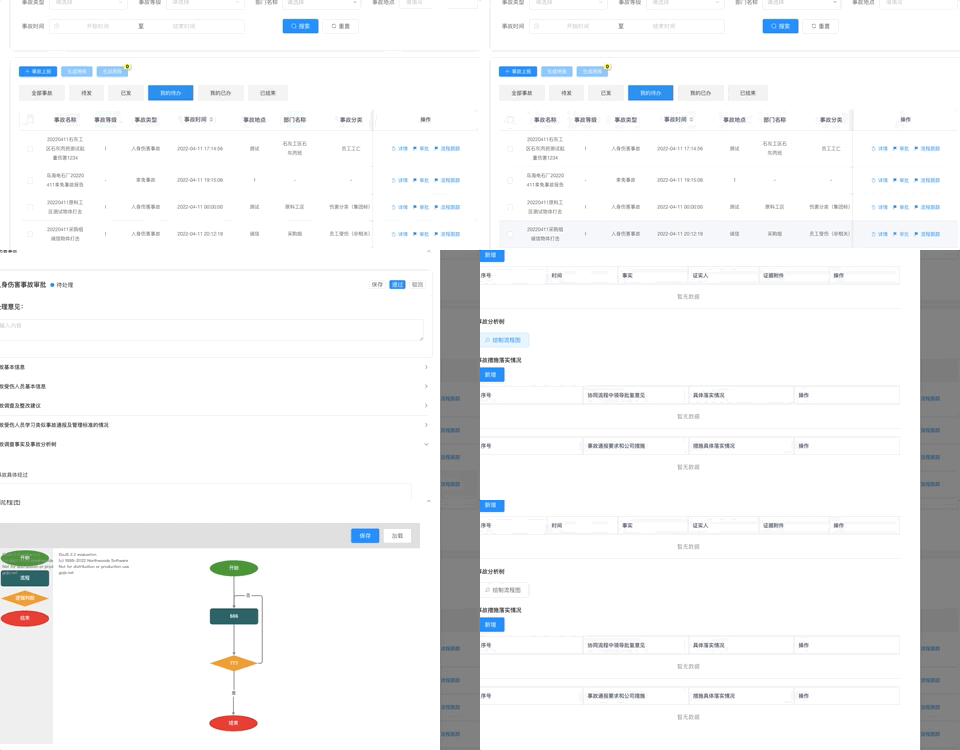
我实现的是:点击按钮,弹出绘制流程图的弹窗,绘制完保存
1、父页面中将写成了组件的流程图引入:
<el-dialog title="绘制流程图" :visible.sync="drawDialog" width="80%">
  <flowDrawing @getFlowModel="getFlowModel" :chartFlowsheet="chartFlowsheet" />
</el-dialog>
import flowDrawing from 'xxx';
export default {
  components: {
    flowDrawing
  },
  data() {
    return {
    	drawDialog:false,
     	chartFlowsheet:'',
    }
  }
}
 getFlowModel(jsonModel){
 		//这里写得到后的操作
      console.log('this is 你转换过来的json字符串:',jsonModel);
      this.drawDialog = false;
   },
2、组件代码
<template>
  <div id="diagram-contanier">
    <div id="diagram-tool">
      <slot>
        <el-button type="primary" @click="save">保存</el-button>
        <el-button @click="load">加载</el-button>
      </slot>
    </div>
    <div id="diagram-wrap">
      <div id="diagram-palette" ref="palette" />
      <div id="diagram" ref="diagram" />
    </div>
  </div>
</template>
data
 diagram: null,
 palette: null,
 textStyle: {
   font: "bold 9pt Lato, Helvetica, Arial, sans-serif",
   stroke: "#F8F8F8",
 },
 // 默认加载的数据长这样
 chart: {
   class: "GraphLinksModel",
   linkFromPortIdProperty: "fromPort",
   linkToPortIdProperty: "toPort",
   nodeDataArray: [
     {
       category: "Start",
       text: "开始",
       key: -1,
       loc: "-107.94070280440474 -309.08209495195183",
     },
     { text: "流程", key: -2, loc: "-107.68839591351332 -189.421875" },
     {
       category: "Conditional",
       text: "逻辑判断",
       key: -3,
       loc: "-107.84415803147851 -72.68596298078074",
     },
     {
       category: "End",
       text: "结束",
       key: -4,
       loc: "-109.21840230579596 76.632035837822",
     },
   ],
   linkDataArray: [
     {
       from: -2,
       to: -3,
       fromPort: "B",
       toPort: "T",
       points: [-107.68839591351332,-169.421875,-107.68839591351332,-159.421875,-107.68839591351332,-131.05391899039037,-107.84415803147851,-131.05391899039037,-107.84415803147851,-102.68596298078074,-107.84415803147851,-92.68596298078074,],
     },
     {
       from: -1,
       to: -2,
       fromPort: "B",
       toPort: "T",
       points: [-107.94070280440474,-289.08209495195183,-107.94070280440474,-279.08209495195183,-107.94070280440474,-249.25198497597592,-107.68839591351332,-249.25198497597592,-107.68839591351332,-219.421875,-107.68839591351332,-209.421875,],
     },
     {
       from: -3,
       to: -4,
       fromPort: "B",
       toPort: "T",
       visible: true,
       points: [-107.84415803147851,-52.685962980780744,-107.84415803147851,-42.685962980780744,-107.84415803147851,1.9730364285206292,-109.21840230579596,1.9730364285206292,-109.21840230579596,46.632035837822,-109.21840230579596,56.632035837822,],
       text: "是",
     },
     {
       from: -3,
       to: -2,
       fromPort: "R",
       toPort: "T",
       visible: true,
       points: [-47.844158031478514,-72.68596298078074,-37.844158031478514,-72.68596298078074,-37.844158031478514,-240.921875,-107.68839591351332,-240.921875,-107.68839591351332,-219.421875,-107.68839591351332,-209.421875,],
       text: "否",
     },
   ],
 },
mounted
const showLinkLabel = (e) => {
      var label = e.subject.findObject("LABEL");
      if (label !== null)
        label.visible = e.subject.fromNode.data.category === "Conditional";
    };

    this.diagram = go.GraphObject.make(go.Diagram, this.$refs["diagram"], {
      LinkDrawn: showLinkLabel,
      LinkRelinked: showLinkLabel,
      "undoManager.isEnabled": true, // enable undo & redo
    });
    this.setLinkTemplate();
    this.createPattle();

    // 设置 linkFromPortIdProperty 属性, 避免 link 自己重绘
    this.diagram.model.linkFromPortIdProperty = "fromPort"; // 必须记住portIds
    this.diagram.model.linkToPortIdProperty = "toPort";

    this.diagram.toolManager.linkingTool.temporaryLink.routing =
      go.Link.Orthogonal;
    this.diagram.toolManager.relinkingTool.temporaryLink.routing =
      go.Link.Orthogonal;
methods
父子数据传递:回显保存的字符串
  props: {
    chartFlowsheet:{
      type: String,
      default: ''
    }
  }
监听到父页面传值变化而重新给流程图赋值:更新视图
   watch: {
    chartFlowsheet(val) {
      this.diagram.model = go.Model.fromJson(val)
    }
  },
保存按钮
save() {
// 我的代码需要JSON
格式
this.$emit('getFlowModel',this.diagram.model.toJson())
},
加载按钮:直接加载出一个默认模板
load() {
  this.diagram.model = go.Model.fromJson(this.chart);
},
创建流程图区域
    createPattle() {
      this.diagram.nodeTemplateMap.add(
        "", // the default category
        go.GraphObject.make(
          go.Node,
          "Table",
          this.nodeStyle(),
          // the main object is a Panel that surrounds a TextBlock with a rectangular Shape
          go.GraphObject.make(
            go.Panel,
            "Auto",
            go.GraphObject.make(
              go.Shape,
              "RoundedRectangle",
              {
                desiredSize: new go.Size(120, 40),
                fill: "#006266",
                strokeWidth: 0,
              },
              new go.Binding("figure", "figure"),
              new go.Binding("fill", "color")
            ),
            go.GraphObject.make(
              go.TextBlock,
              this.textStyle,
              {
                margin: 8,
                maxSize: new go.Size(160, NaN),
                wrap: go.TextBlock.WrapFit,
                editable: true,
              },
              new go.Binding("text").makeTwoWay()
            ),
            {
              // define a context menu for each node
              contextMenu: go.GraphObject.make(
                "ContextMenu",
                go.GraphObject.make(
                  "ContextMenuButton",
                  {
                    "ButtonBorder.fill": "white",
                    _buttonFillOver: "skyblue",
                  },
                  go.GraphObject.make(go.TextBlock, "change color"),
                  { click: this.changeColor }
                )
                // more ContextMenuButtons would go here
              ), // end Adornment
            }
          ),
          // four named ports, one on each side:
          this.makePort("T", go.Spot.Top, go.Spot.Top, false, true),
          this.makePort("L", go.Spot.Left, go.Spot.Left, true, true),
          this.makePort("R", go.Spot.Right, go.Spot.Right, true, true),
          this.makePort("B", go.Spot.Bottom, go.Spot.Bottom, true, false)
        )
      );
      this.diagram.nodeTemplateMap.add(
        "Conditional",
        go.GraphObject.make(
          go.Node,
          "Table",
          this.nodeStyle(),
          // the main object is a Panel that surrounds a TextBlock with a rectangular Shape
          go.GraphObject.make(
            go.Panel,
            "Auto",
            go.GraphObject.make(
              go.Shape,
              "Diamond",
              {
                desiredSize: new go.Size(120, 40),
                fill: "#F79F1F",
                strokeWidth: 0,
              },
              new go.Binding("figure", "figure")
            ),
            go.GraphObject.make(
              go.TextBlock,
              this.textStyle,
              {
                margin: 8,
                maxSize: new go.Size(160, NaN),
                wrap: go.TextBlock.WrapFit,
                editable: true,
              },
              new go.Binding("text").makeTwoWay()
            )
          ),
          // four named ports, one on each side:
          this.makePort("T", go.Spot.Top, go.Spot.Top, false, true),
          this.makePort("L", go.Spot.Left, go.Spot.Left, true, true),
          this.makePort("R", go.Spot.Right, go.Spot.Right, true, true),
          this.makePort("B", go.Spot.Bottom, go.Spot.Bottom, true, false)
        )
      );
      this.diagram.nodeTemplateMap.add(
        "Start",
        go.GraphObject.make(
          go.Node,
          "Table",
          this.nodeStyle(),
          go.GraphObject.make(
            go.Panel,
            "Spot",
            go.GraphObject.make(go.Shape, "Ellipse", {
              desiredSize: new go.Size(120, 40),
              fill: "#009432",
              strokeWidth: 0,
            }),
            go.GraphObject.make(go.TextBlock, "Start", this.textStyle, new go.Binding("text"))
          ),
          // 创建端口, 以供连线(开始节点仅创建底部一个端口)
          // this.makePort('L', go.Spot.Left, go.Spot.Left, true, false),
          // this.makePort('R', go.Spot.Right, go.Spot.Right, true, false),
          this.makePort("B", go.Spot.Bottom, go.Spot.Bottom, true, false)
        )
      );
      this.diagram.nodeTemplateMap.add(
        "End",
        go.GraphObject.make(
          go.Node,
          "Table",
          this.nodeStyle(),
          go.GraphObject.make(
            go.Panel,
            "Spot",
            go.GraphObject.make(go.Shape, "Ellipse", {
              desiredSize: new go.Size(120, 40),
              fill: "#EA2027",
              strokeWidth: 0,
            }),
            go.GraphObject.make(go.TextBlock, "End", this.textStyle, new go.Binding("text"))
          ),
          // 创建端口, 以供连线(结束节点仅创建顶部一个端口)
          this.makePort("T", go.Spot.Top, go.Spot.Top, false, true)
          // this.makePort('L', go.Spot.Left, go.Spot.Left, false, true),
          // this.makePort('R', go.Spot.Right, go.Spot.Right, false, true)
        )
      );

      this.palette = go.GraphObject.make(
        go.Palette,
        this.$refs["palette"],
        {
          allowZoom: false,
          "animationManager.initialAnimationStyle": go.AnimationManager.None,
          InitialAnimationStarting: this.animateFadeDown,
          nodeTemplateMap: this.diagram.nodeTemplateMap,
          model: new go.GraphLinksModel([
            // specify the contents of the Palette
            { category: "Start", text: "开始" },
            { text: "流程" },
            { category: "Conditional", text: "逻辑判断" },
            { category: "End", text: "结束" },
          ]),
        }
      );
    },
    changeColor(e, obj) {
      this.diagram.commit((d) => {
        var contextmenu = obj.part;
        var nodedata = contextmenu.data;
        var newcolor = "lightblue";
        switch (nodedata.color) {
          case "lightblue":
            newcolor = "lightgreen";
            break;
          case "lightgreen":
            newcolor = "lightyellow";
            break;
          case "lightyellow":
            newcolor = "orange";
            break;
          case "orange":
            newcolor = "lightblue";
            break;
        }
        d.model.set(nodedata, "color", newcolor);
      }, "changed color");
    },
设置 全局 link 样式
  setLinkTemplate() {
      this.diagram.linkTemplate = go.GraphObject.make(
        go.Link,
        {
          routing: go.Link.AvoidsNodes, // 避免 link 穿过节点
          curve: go.Link.JumpOver, //  交叉线 设置
          corner: 5, // 连接线转角弧度
          toShortLength: 4,
          relinkableFrom: true,
          relinkableTo: true,
          reshapable: true,
          mouseEnter: function (e, link) {
            link.findObject("HIGHLIGHT").stroke = "rgba(30,144,255,0.2)";
          },
          mouseLeave: function (e, link) {
            link.findObject("HIGHLIGHT").stroke = "transparent";
          },
          selectionAdorned: false,
        },
        new go.Binding("points").makeTwoWay(),
        go.GraphObject.make(
          go.Shape,
          {
            isPanelMain: true,
            strokeWidth: 8,
            stroke: "transparent",
            name: "HIGHLIGHT",
          }
        ),
        go.GraphObject.make(
          go.Shape, // the link path shape
          { isPanelMain: true, stroke: "gray", strokeWidth: 2 },
          new go.Binding("stroke", "isSelected", function (sel) {
            return sel ? "dodgerblue" : "gray";
          }).ofObject()
        ),
        go.GraphObject.make(
          go.Shape, // the arrowhead
          { toArrow: "standard", strokeWidth: 0, fill: "gray" }
        ),
        go.GraphObject.make(
          go.Panel,
          "Auto", // the link label, normally not visible
          {
            visible: false,
            name: "LABEL",
            segmentIndex: 2,
            segmentFraction: 0.5,
          },
          new go.Binding("visible", "visible").makeTwoWay(),
          go.GraphObject.make(
            go.Shape,
            "RoundedRectangle", // the label shape
            { fill: "#F8F8F8", strokeWidth: 0 }
          ),
          go.GraphObject.make(
            go.TextBlock,
            "是", // the label
            {
              textAlign: "center",
              font: "8pt helvetica, arial, sans-serif",
              stroke: "#333333",
              editable: true,
            },
            new go.Binding("text").makeTwoWay()
          )
        )
      );
    },
    animateFadeDown(e) {
      var diagram = e.diagram;
      var animation = new go.Animation();
      animation.isViewportUnconstrained = true; // So Diagram positioning rules let the animation start off-screen
      animation.easing = go.Animation.EaseOutExpo;
      animation.duration = 900;
      // Fade "down", in other words, fade in from above
      animation.add(
        diagram,
        "position",
        diagram.position.copy().offset(0, 200),
        diagram.position
      );
      animation.add(diagram, "opacity", 0, 1);
      animation.start();
    },
  nodeStyle() {
      return [
        new go.Binding("location", "loc", go.Point.parse).makeTwoWay(
          go.Point.stringify
        ),
        { locationSpot: go.Spot.Center },
      ];
    },
创建端口, 以供连线
makePort(name, align, spot, output, input) {
      var horizontal =
        align.equals(go.Spot.Top) || align.equals(go.Spot.Bottom);
      // the port is basically just a transparent rectangle that stretches along the side of the node,
      // and becomes colored when the mouse passes over it
      return go.GraphObject.make(go.Shape, {
        fill: "transparent", // changed to a color in the mouseEnter event handler
        strokeWidth: 0, // no stroke
        width: horizontal ? NaN : 8, // if not stretching horizontally, just 8 wide
        height: !horizontal ? NaN : 8, // if not stretching vertically, just 8 tall
        alignment: align, // align the port on the main Shape
        stretch: horizontal
          ? go.GraphObject.Horizontal
          : go.GraphObject.Vertical,
        portId: name, // declare this object to be a "port"
        fromSpot: spot, // declare where links may connect at this port
        fromLinkable: output, // declare whether the user may draw links from here
        toSpot: spot, // declare where links may connect at this port
        toLinkable: input, // declare whether the user may draw links to here
        cursor: "pointer", // show a different cursor to indicate potential link point
        mouseEnter: function (e, port) {
          // the PORT argument will be this Shape
          if (!e.diagram.isReadOnly) port.fill = "rgba(255,0,255,0.5)";
        },
        mouseLeave: function (e, port) {
          port.fill = "transparent";
        },
      });
    },
CSS
<style lang="scss" scoped>
#diagram-contanier {
  height: 550px;
  display: flex;
  flex-direction: column;
  border: 1px solid #eee;
  #diagram-tool {
    width: 100%;
    height: 70px;
    line-height: 40px;
    background-color: #dfdfdf;
    display: flex;
    align-items: center;
    justify-content: flex-end;
    padding-right: 20px;
  }

  #diagram-wrap {
    flex-grow: 1;
    height: 100%;
    display: flex;
    #diagram-palette {
      flex: 0 0 140px;
      height: 100%;
      // border-right: 1px solid #dfdfdf;
      background-color: #eee;
    }
    #diagram {
      width: 100%;
      flex-grow: 1;
    }

    ::v-deep canvas {
      outline: none;
    }
  }
}
</style>


