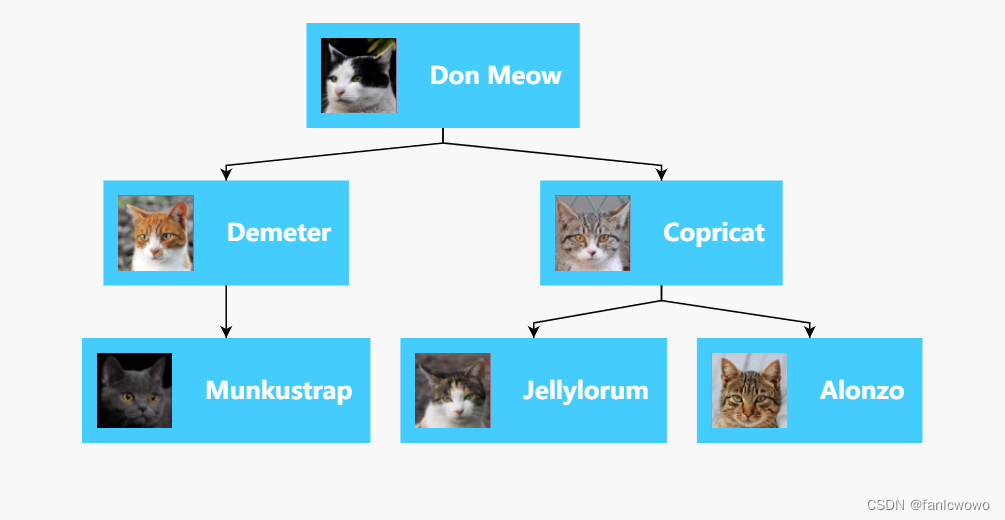
GoJS是一个用于实现交互式图表的JavaScript库。本页将向您展示使用GoJS的要点。
因为GoJS是一个依赖HTML5特性的JavaScript库,所以你开发的页面是在HTML5的基础上。当然,首先需要加载库:
<!DOCTYPE html>  <!-- 指定文档类型为 HTML5  -->
<html>
<head>
<!-- 开发时请使用 go-debug.js,最终部署用 go.js -->
<script src="go-debug.js"></script>您可以到?下载页面?下载最新版 GoJS(包含所有例子),或者直接引用?CDN?文件:
<script src="https://unpkg.com/gojs/release/go-debug.js"></script>每个?GoJS?图形实例都需要一个 HTML 容器?<div>?并明确指定其大小:
<!-- 图形的容器 div 需要明确指定大小,否则无法显示,本例子中我们还给该 DIV 添加了一个背景颜色,可以很方便的查看其大小。 -->
<div id="myDiagramDiv"
  style="width:400px; height:150px; background-color: #DAE4E4;"></div>
在 JS 代码中,需要将?<div>?的?id?作为参数来创建图形。
var $ = go.GraphObject.make;
var myDiagram = $(go.Diagram, "myDiagramDiv");
注意,go是命名空间,所有的GoJs的类型都依赖于它,所有使用GoJs的类例如Diagram 、Node 、 Panel 、Shape 、 TextBlock都需要加前缀go.,
这篇文章将向您展示如何使用go.GraphObject.make去创建GoJs对象,想了解更多的信息,请点击 http://gojs.net/latest/intro/buildingObjects.html
这里就相当于一个变量,表示命名空间,如果你的项目中有使用到例如Jquery,也是使用的就相当于一个变量,表示命名空间,如果你的项目中有使用到例如Jquery,也是使用的,你可以将GoJs的命名空间变量随意定义一个,例如GO,make,$$等
图形和模型
节点和连线是图表必须的,他们是通过Model管理的,GoJs有一个model-view视图解析器,这里的模型(Model)数据描述了节点(node),连线(link),图表行为,然后去真正渲染节点和连线。model不是图表,它是你用来加载或编辑后用来保存数据的,你可以添加你项目所需要的图表配置信息,不需要保存或修改图表,GoJs会将Model渲染成图表。
这儿有一个事例是关于图表和模型的:
?
var $ = go.GraphObject.make;
var myDiagram =
  $(go.Diagram, "myDiagramDiv",
    {
      "undoManager.isEnabled": true // enable Ctrl-Z to undo and Ctrl-Y to redo
    });

var myModel = $(go.Model);
// in the model data, each node is represented by a JavaScript object:
myModel.nodeDataArray = [
  { key: "Alpha" },
  { key: "Beta" },
  { key: "Gamma" }
];
myDiagram.model = myModel;
运行代码后会生成三个节点,这儿生成的就是图表,图表中包含三个节点
- 点击背景可以拖动,
- 选中一个节点可以拖动
- 可以复制,粘贴
- 可以使用delete删除
- 可以使用ctrl+z或ctrl+y进行undo或redo
给节点添加样式
节点样式是通过图表对象的模板以及一些设置属性实现的,要创建一个节点我们有几个类需要处理。
- Shape:外形, 去展示预定义的或默认的尺寸及颜色等
- TextBlock:文本块, 展示各式各样的字体
- Picture:图片, 展示图片
-?Panel:面板, 可以放置其他对象像tables等
所有的这些块都是图表对象的一部分,我们可以访问?GraphObject的属性,方法、节点对象是?GraphObject而不是Document对象,所以我们在创建的时候不能像平常创建document对象一样。
我们想让model对象影响节点的显示,这里是通过数据绑定实现的。
默认的节点模板很简单:一个包含一个文本块的节点。TextBlock的text属性和模型数据的key属性之间存在数据绑定。在代码中,模板如下所示:
myDiagram.nodeTemplate =
  $(go.Node,
    $(go.TextBlock,
      // TextBlock.text is bound to Node.data.key
      new go.Binding("text", "key"))
  );
TextBlocks, Shapes, 和Pictures是GoJ的基本构建块。TextBlocks不能包含图像;Shapes不能包含文本。如果希望节点显示一些文本,则必须使用TextBlocks。如果你想画或填充一些几何图形,你必须使用一个Shapes。
一般来说,节点模板的结构如下所示:
myDiagram.nodeTemplate =
$(go.Node, "Vertical", // second argument of a Node/Panel can be a Panel type
/* set Node properties here */
{ // the Node.location point will be at the center of each node
locationSpot: go.Spot.Center
},
/* add Bindings here */
// example Node binding sets Node.location to the value of Node.data.loc
new go.Binding("location", "loc"),
/* add GraphObjects contained within the Node */
// this Shape will be vertically above the TextBlock
$(go.Shape,
"RoundedRectangle", // string argument can name a predefined figure
{ /* set Shape properties here */ },
// example Shape binding sets Shape.figure to the value of Node.data.fig
new go.Binding("figure", "fig")),
$(go.TextBlock,
"default text",  // string argument can be initial text string
{ /* set TextBlock properties here */ },
// example TextBlock binding sets TextBlock.text to the value of Node.data.key
new go.Binding("text", "key"))
);
Panels?面板中GraphObjects的嵌套可以是任意深度的,每个类都有自己独特的属性集可供使用,表明总体思路。
现在,我们已经了解了如何制作Node模板,让我们来看一个实例。我们将制作一个在组织图中常见的简单模板。
"Horizontal":面板类型的节点,意味着其元素将水平并排布置。它有两个要素:
- Picture 为人像,与图像源数据绑定
- ?TextBlock 用于名称,并绑定文本数据
var $ = go.GraphObject.make;
var myDiagram =
$(go.Diagram, "myDiagramDiv",
{
"undoManager.isEnabled": true // enable Ctrl-Z to undo and Ctrl-Y to redo
});
// define a simple Node template
myDiagram.nodeTemplate =
$(go.Node, "Horizontal",
// the entire node will have a light-blue background
{ background: "#44CCFF" },
$(go.Picture,
// Pictures should normally have an explicit width and height.
// This picture has a red background, only visible when there is no source set
// or when the image is partially transparent.
{ margin: 10, width: 50, height: 50, background: "red" },
// Picture.source is data bound to the "source" attribute of the model data
new go.Binding("source")),
$(go.TextBlock,
"Default Text",  // the initial value for TextBlock.text
// some room around the text, a larger font, and a white stroke:
{ margin: 12, stroke: "white", font: "bold 16px sans-serif" },
// TextBlock.text is data bound to the "name" attribute of the model data
new go.Binding("text", "name"))
);
var model = $(go.Model);
model.nodeDataArray =
[ // note that each node data object holds whatever properties it needs;
// for this app we add the "name" and "source" properties
{ name: "Don Meow", source: "/images/learn/cat1.png" },
{ name: "Copricat", source: "/images/learn/cat2.png" },
{ name: "Demeter",  source: "/images/learn/cat3.png" },
{ /* Empty node data */  }
];
myDiagram.model = model;
效果如下图:

当图像或者数据未加载时,我们可能希望显示一些默认状态。
各种模型
为了在我们的图表中加入链接,基本模型不会对其进行剪裁。我们可以选择GoJS中另外两个模型中的一个,这两个模型都支持链接。这些是GraphlinkModel和TreeModel。(请在此处阅读有关模型的更多信息。
在GraphlinkModel中,我们有model。除了模型之外,还有linkDataArray。nodeDataArray。它包含一个JavaScript对象数组,每个对象通过指定“to”和“from”节点键来描述链接。下面是一个示例,其中节点A链接到节点B,节点B链接到节点C:
var model = $(go.GraphLinksModel);
model.nodeDataArray =
[
{ key: "A" },
{ key: "B" },
{ key: "C" }
];
model.linkDataArray =
[
{ from: "A", to: "B" },
{ from: "B", to: "C" }
];
myDiagram.model = model;
GraphlinkModel允许节点之间有任意数量的链接,可以向任意方向移动。从A到B可能有十个链接,从B到A可能有三个反向链接。
TreeModel的工作原理有点不同。树模型中的链接不是维护单独的链接数据数组,而是通过为节点数据指定“parent”来创建的。然后从该关联创建链接。下面是与树模型相同的示例,其中节点a链接到节点B,节点B链接到节点C:
var model = $(go.TreeModel);
model.nodeDataArray =
[
{ key: "A" },
{ key: "B", parent: "A" },
{ key: "C", parent: "B" }
];
myDiagram.model = model;
TreeModel比GraphlinkModel简单,但它不能建立任意链接关系,例如同两个节点之间的多个链接,或具有多个父节点。我们的组织结构图是一个简单的层次树状结构,因此我们将选择TreeModel作为本例的示例。
首先,我们将通过添加几个节点、使用树模型并在数据中指定键和父节点来完成数据。
var $ = go.GraphObject.make;
var myDiagram =
$(go.Diagram, "myDiagramDiv",
{
"undoManager.isEnabled": true // enable Ctrl-Z to undo and Ctrl-Y to redo
});
// the template we defined earlier
myDiagram.nodeTemplate =
$(go.Node, "Horizontal",
{ background: "#44CCFF" },
$(go.Picture,
{ margin: 10, width: 50, height: 50, background: "red" },
new go.Binding("source")),
$(go.TextBlock, "Default Text",
{ margin: 12, stroke: "white", font: "bold 16px sans-serif" },
new go.Binding("text", "name"))
);
var model = $(go.TreeModel);
model.nodeDataArray =
[ // the "key" and "parent" property names are required,
// but you can add whatever data properties you need for your app
{ key: "1",              name: "Don Meow",   source: "/images/learn/cat1.png" },
{ key: "2", parent: "1", name: "Demeter",    source: "/images/learn/cat2.png" },
{ key: "3", parent: "1", name: "Copricat",   source: "/images/learn/cat3.png" },
{ key: "4", parent: "3", name: "Jellylorum", source: "/images/learn/cat4.png" },
{ key: "5", parent: "3", name: "Alonzo",     source: "/images/learn/cat5.png" },
{ key: "6", parent: "2", name: "Munkustrap", source: "/images/learn/cat6.png" }
];
myDiagram.model = model;
图形布局
正如您所看到的,树模型自动创建必要的链接来关联节点,但很难判断谁是谁的父节点。
图表有一个默认布局,该布局会获取所有没有位置的节点,并为它们提供位置,将它们排列在网格中。我们可以明确地给每个节点一个位置来整理混乱的组织,但在我们的例子中,作为一个更简单的解决方案,我们可以使用一个布局,自动为我们提供良好的位置。
在使用TreeModel的基础上,我们想要显示一个层次结构,最自然的布局选择是TreeLayout。TreeLayout默认为从左到右流动,因此为了使其从上到下流动(这在组织图中很常见),我们将angle属性设置为90。
在GoJS中使用布局通常很简单,但每种布局都有许多影响结果的属性,每个布局(如TreeLayout Demo)都有展示其属性的示例。
// define a TreeLayout that flows from top to bottom
myDiagram.layout =
$(go.TreeLayout,
{ angle: 90, layerSpacing: 35 });GoJS还有其他几个布局,你可以在这里阅读。
到目前为止,将布局添加到图表和模型中,我们可以看到的效果如下图:
var $ = go.GraphObject.make;
var myDiagram =
$(go.Diagram, "myDiagramDiv",
{
"undoManager.isEnabled": true, // enable Ctrl-Z to undo and Ctrl-Y to redo
layout: $(go.TreeLayout, // specify a Diagram.layout that arranges trees
{ angle: 90, layerSpacing: 35 })
});
// the template we defined earlier
myDiagram.nodeTemplate =
$(go.Node, "Horizontal",
{ background: "#44CCFF" },
$(go.Picture,
{ margin: 10, width: 50, height: 50, background: "red" },
new go.Binding("source")),
$(go.TextBlock, "Default Text",
{ margin: 12, stroke: "white", font: "bold 16px sans-serif" },
new go.Binding("text", "name"))
);
var model = $(go.TreeModel);
model.nodeDataArray =
[
{ key: "1",              name: "Don Meow",   source: "/images/learn/cat1.png" },
{ key: "2", parent: "1", name: "Demeter",    source: "/images/learn/cat2.png" },
{ key: "3", parent: "1", name: "Copricat",   source: "/images/learn/cat3.png" },
{ key: "4", parent: "3", name: "Jellylorum", source: "/images/learn/cat4.png" },
{ key: "5", parent: "3", name: "Alonzo",     source: "/images/learn/cat5.png" },
{ key: "6", parent: "2", name: "Munkustrap", source: "/images/learn/cat6.png" }
];
myDiagram.model = model;
我们的图表开始看起来像一个合适的组织结构图,但我们可以通过链接做得更好。
连线模板?
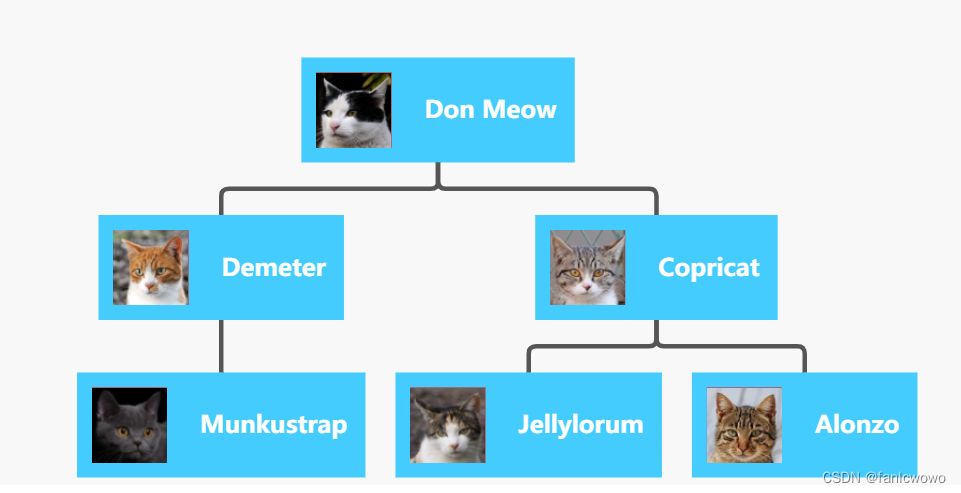
我们将构建一个新的链接模板,该模板将更好地适应我们宽大的方形节点。链接不同于节点,主要元素是链接的形状,必须是由GoJS动态计算其几何体的形状。我们的链接将由这个形状组成,其笔划比正常的笔划略厚,由黑色变为深灰色。与默认链接模板不同,我们没有箭头。我们将把Link 的“routing?”属性“Normal”改为“Orthogonal”,并设置一个边框圆角。
// define a Link template that routes orthogonally, with no arrowhead
myDiagram.linkTemplate =
$(go.Link,
// default routing is go.Link.Normal
// default corner is 0
{ routing: go.Link.Orthogonal, corner: 5 },
$(go.Shape, { strokeWidth: 3, stroke: "#555" }) // the link shape
// if we wanted an arrowhead we would also add another Shape with toArrow defined:
// $(go.Shape, { toArrow: "Standard", stroke: null }
);
?将链接模板与节点模板TreeModel和TreeLayout结合起来,我们最终得到了完整的组织结构图。下面完整的代码,生成的图表如下:
var $ = go.GraphObject.make;
var myDiagram =
$(go.Diagram, "myDiagramDiv",
{
"undoManager.isEnabled": true, // enable Ctrl-Z to undo and Ctrl-Y to redo
layout: $(go.TreeLayout, // specify a Diagram.layout that arranges trees
{ angle: 90, layerSpacing: 35 })
});
// the template we defined earlier
myDiagram.nodeTemplate =
$(go.Node, "Horizontal",
{ background: "#44CCFF" },
$(go.Picture,
{ margin: 10, width: 50, height: 50, background: "red" },
new go.Binding("source")),
$(go.TextBlock, "Default Text",
{ margin: 12, stroke: "white", font: "bold 16px sans-serif" },
new go.Binding("text", "name"))
);
// define a Link template that routes orthogonally, with no arrowhead
myDiagram.linkTemplate =
$(go.Link,
{ routing: go.Link.Orthogonal, corner: 5 },
$(go.Shape, { strokeWidth: 3, stroke: "#555" })); // the link shape
var model = $(go.TreeModel);
model.nodeDataArray =
[
{ key: "1",              name: "Don Meow",   source: "/images/learn/cat1.png" },
{ key: "2", parent: "1", name: "Demeter",    source: "/images/learn/cat2.png" },
{ key: "3", parent: "1", name: "Copricat",   source: "/images/learn/cat3.png" },
{ key: "4", parent: "3", name: "Jellylorum", source: "/images/learn/cat4.png" },
{ key: "5", parent: "3", name: "Alonzo",     source: "/images/learn/cat5.png" },
{ key: "6", parent: "2", name: "Munkustrap", source: "/images/learn/cat6.png" }
];
myDiagram.model = model;
更多内容
如果需要阅读更多教程,例如GraphObject操纵教程,也可以在YouTube上观看教程。
