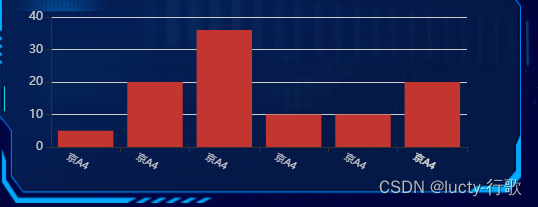
function echartsOne(){
		var myChart = echarts.init(document.getElementById('main'));
        // 指定图表的配置项和数据
        var option = {
            tooltip: {},
            grid:{
            	//定位
            	top:'10%',
            	bottom:'25%',
               },
            legend: {
                data:[],
                textStyle: {
                    color: '#ccc'  // 图例文字颜色
                }
            },
            xAxis: {
                data: ["京A4","京A4","京A4","京A4","京A4","京A4"],
                axisLabel: { //轴文字标签
                    show: true,
                },
                axisLabel: {
               	   interval:0,
               	   rotate:-30, //x轴文字倾斜
               	   padding: [20, 0, 0, -15], //文字左右定位
	               textStyle: {
	                  color: '#ccc', //文字颜色
	                  fontSize:'10', //文字大小
	               },
               	},
            },
            yAxis: {
            	axisLabel: { //轴文字标签
                    show: true,
                    textStyle: {
                        color: '#ccc',
                    }
                },
            },
            series: [{
                name: '销量',
                type: 'bar',
                data: [5, 20, 36, 10, 10, 20]
            }]
        };
        myChart.setOption(option)
	}

