|

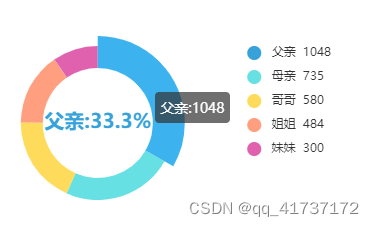
<div ref="pie" style="height:220px; width: 80%;"></div>


   getPie() {
        const pie = this.$refs.pie
        const pieChart = this.$echarts.init(pie, 'light')
        let seriesDataPie = [];
        var res = [
          { value: 1048, name: '父亲' },
          { value: 735, name: '母亲' },
          { value: 580, name: '哥哥' },
          { value: 484, name: '姐姐' },
          { value: 300, name: '妹妹' }
        ]
        // request.getData({ thisMonth: 1 }).then(({
        request.getData().then(({
          object
        }) => {
          console.log("33333", object)

          if (res.length > 0) {
            const total = 10
            const option = {
              title: {},
              tooltip: {
                trigger: 'item',
                formatter: "{b}:{c}"
              },
              legend: {
                top: 'center',
                orient: 'vertical',
                right: 'right',
                icon: "circle",   //  字段控制形状  类型包括 circle,rect,line,roundRect,triangle,diamond,pin,arrow,none

                formatter: function (name) {
                  var data = res;
                  var total = 0;
                  var target;
                  data.forEach((item, index) => {
                    total += data[index].value;
                    if (data[index].name == name) {
                      target = data[index].value;
                    }
                  })
                  return name + '  ' + target;
                  //return ((target / total) * 100).toFixed(2) + '%'
                },

              },
              series: [
                {
                  type: 'pie',
                  radius: ['50%', '70%'],
                  center: ["40%", "60%"],
                  label: {
                    show: false,
                    position: 'center'
                  },
                  emphasis: {
                    label: {
                      show: true,
                      fontSize: '20',
                      fontWeight: 'bold',
                      formatter: "{b}:{d}%" /*饼状图内显示百分比*/,
                    },
                  },

                  data: res
                }
              ]
            }

            pieChart.setOption(option)

            window.addEventListener('resize', function () {
              pieChart.resize()
            })
            this.$on('hook:destroyed', () => {
              window.removeEventListener('resize', () => {
                pieChart.resize()
              })
            })
          } else {
            this.msg = '暂无数据'
          }
        })
      },

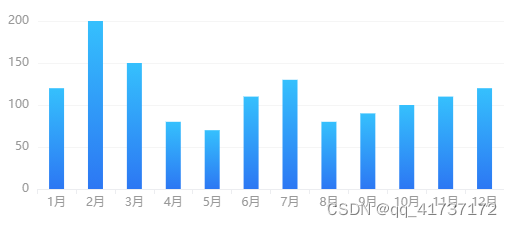
          <div ref="barMonitor" style="height:240px;" :class="{'chartMsg':msg!=''}" v-html="msg">{{ msg }}</div>


   getBarMonitor() {
        const barMonitor = this.$refs.barMonitor
        const barMonitorChart = this.$echarts.init(barMonitor, 'light')
        barMonitor.removeAttribute("_echarts_instance_");
        request.getData().then(res => {
          const data = [{ time: 1, value: 120 }, { time: 2, value: 200 }, { time: 3, value: 150 },
          { time: 4, value: 80 }, { time: 5, value: 70 }, { time: 6, value: 110 },
          { time: 7, value: 130 }, { time: 8, value: 80 }, { time: 9, value: 90 },
          { time: 10, value: 100 }, { time: 11, value: 110 }, { time: 12, value: 120 }]
          var time = []
          var value = []
          data.forEach((item) => {
            time.push(item.time + "月")
            value.push(item.value)
          })
          const _this = this
          if (barMonitor && data.length > 0) {
            const option = {
              'grid': {
                'top': '40',
                'left': '0',
                'bottom': '5%',
                'right': '0',
                'containLabel': true
              },
              xAxis: {
                type: 'category',
                date: time,
                axisLine: {
                  show: false,
                },
                axisLabel: {//y轴文字的配置
                  textStyle: {
                    color: "#999",//Y轴内容文字颜色
                  },
                },
                axisLine: {//y轴线的配置
                  show: true,//是否展示
                  lineStyle: {
                    color: "#ECEDF0",//y轴线的颜色(若只设置了y轴线的颜色,未设置y轴文字的颜色,则y轴文字会默认跟设置的y轴线颜色一致)
                    width: 1,//y轴线的宽度
                    type: "solid"//y轴线为实线
                  },
                },
              },
              yAxis: {
                type: 'value',
                axisLine: {
                  show: false,
                },
                axisLabel: {//y轴文字的配置
                  textStyle: {
                    color: "#999",//Y轴内容文字颜色
                  },
                },
                axisLine: {//y轴线的配置
                  show: true,//是否展示
                  lineStyle: {
                    color: "#fff",//y轴线的颜色(若只设置了y轴线的颜色,未设置y轴文字的颜色,则y轴文字会默认跟设置的y轴线颜色一致)
                    width: 1,//y轴线的宽度
                    type: "solid"//y轴线为实线
                  },
                },
                splitLine: {//分割线配置
                  show: true,
                  lineStyle: {
                    color: "#f5f5f5",
                  },
                },
              },
              series: [
                {
                  data: value,
                  type: 'bar',
                  barWidth: 15,
                  color: new this.$echarts.graphic.LinearGradient(0, 0, 0, 1,
                    [
                      { offset: 0, color: "#35c0fd" },
                      { offset: 1, color: "#2c77f3" }
                    ],
                    false
                  ) // 渐变
                }
              ]
            }

            barMonitorChart.setOption(option)
            window.addEventListener('resize', function () {
              barMonitorChart.resize()
            })
            this.$on('hook:destroyed', () => {
              window.removeEventListener('resize', () => {
                barMonitorChart.resize()
              })
            })
          } else {
            this.msg = '暂无数据'
          }
        }).catch()
      },
legend: {
  icon: "circle",   //  字段控制形状  类型包括 circle,rect,line,roundRect,triangle,diamond,pin,arrow,none
  itemWidth: 10,  // 设置宽度
  itemHeight: 10, // 设置高度
  itemGap: 40 // 设置间距
},
 icon 可自定义图片
  icon : 'image://../../images/hsyb/water.png'   /* image://  后跟图片路径*/
|


