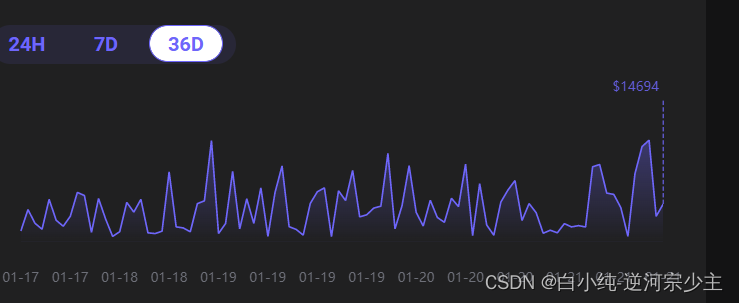
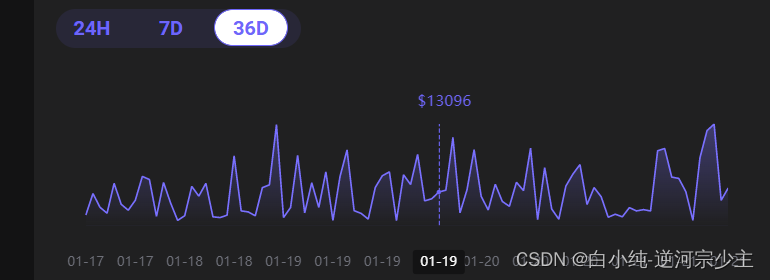
折线图背景渐变
    areaStyle: {
              opacity: 1,
              normal: {
                // 颜色渐变函数 前四个参数分别表示四个位置依次为左、下、右、上
                color: new echarts.graphic.LinearGradient(0, 0, 0, 1, [
                  {
                    offset: 0,
                    color: 'rgba(110, 102, 250, 0.5)'
                  },
                  {
                    offset: 1,
                    color: 'rgba(110, 102, 250, 0)'
                  },
                  {
                    offset: 1,
                    color: 'rgba(110, 102, 250, 0.2)'
                  }
                ])
              }
            }, // 区域颜色渐变
折线图-label-视觉引导线
- labelLayout 是设置点标题名称和视觉引导线链接

为了保持最后一个值的视觉引导线是直线我通过销毁,重新渲染达到初始化效果,
鼠标移动上去最后的那个视觉引导要消失。

这里是控制视觉引导线是否出现,加了防抖功能控制
      const openY = () => {
        y.forEach((item, index) => {
          // 判断数组最后一个值比倒数第二个值小的时候item.label.distance = 160
          if (index === y.length - 1) {
            item.label.show = true
            item.labelLine.show = true
            echarts.dispose(chartDom)
            this.chartLine(this.xAxisData, this.yAxisData)
            if (item.value < this.yAxisData[index - 1]) {
              item.label.distance = 90
            }
            //   console.log('mouseout', item, this.yAxisData[index - 1])
            window.addEventListener('resize', function () {
              myChart.resize()
            })
          }
        })
      }
      const closeY = () => {
        y.forEach((item, index) => {
          if (index === y.length - 1) {
            item.label.show = false
            item.labelLine.show = false
            myChart.resize()
            option && myChart.setOption(option)

            // console.log('mouseover', item)
            window.addEventListener('resize', function () {
              myChart.resize()
            })
          }
        })
      }

      var closeYFn = debounce(closeY, 500)
      var openYFn = debounce(openY, 500)
      myChart.getZr().on('mousemove', (event) => {
        if (!event.target) {
          closeYFn()
        }
      })
      myChart.getZr().on('mouseout', (event) => {
        if (!event.target) {
          openYFn()
        }
      })
- 这里是设置最后一个值出现视觉引导效果,labelLayout 配置视情况而使用,用了labelLayout 就不需要销毁dom也可以实现最后一个值视觉引导线是垂直的,但是labe的标题div会一直处于右边位置,我尝试过很多方法,都没用,而且labe的formatter不支持HTML插入dom。最后采用了销毁重建dom的方式达到鼠标移入消失视觉引导,鼠标移出,出现视觉引导并且处于垂直状态。
        // labelLayout (params) {
            //   console.log('params', params)
            //   return {
            //     x: myChart.getWidth() - 125,
            //     y: -myChart.getHeight() + 250,
            //     verticalAlign: 'middle',
            //     align: 'content'
            //   }
            // },
            // labelLayout: function () {
            //   return {
            //     x: myChart.getWidth() + 160,
            //     moveOverlap: 'shiftX',
            //     align: 'content',
            //     verticalAlign: 'middle'
            //   }
            // },

            // 这里是设置最后一个值出现视觉引导效果,在接口获取处对数据进行处理
            if (index === this.volumeHistory.length - 1) {
            volumeArr.push({
              value: item.volume,
              labelLine: {
                show: true,
                lineStyle: {
                  type: 'dashed'
                }
              },

              label: {
                show: true,
                color: '#6E66FA',
                fontSize: 18,
                fontFamily: 'Roboto',
                borderColor: '#6E66FA',
                // backgroundColor: 'rgba(213, 14, 14, 1)',
                padding: [0, 50, 0, 0], // 调整左右位置
                // align: 'center',
                formatter: (params) => {
                  // console.log(params, 'paramsparams')
                  return `{x|$${params.value}}`
                },
                rich: {
                  x: {
                    position: 'absolute',
                    left: '200px',
                    top: '0px',
                    align: 'left',
                    margin: [0, 5, 0, 5]
                  }
                },
                distance: 100
              }
            })
          } else {
            volumeArr.push(item.volume)
          }
组件代码
<template>
  <div>
    <div id="chartDom" style="height: 215px"></div>
  </div>
</template>

<script>
import * as echarts from 'echarts'
import {
  debounce
  // throttle
} from '@/utils/common'
export default {
  prop: {
    xAxisData: {
      type: Array,
      default: () => []
    },
    yAxisData: {
      type: Array,
      default: () => []
    }
  },
  data () {
    return {}
  },
  mounted () {},
  methods: {
    chartLine (x, y) {
      this.yAxisData = y
      this.xAxisData = x
      var chartDom = document.getElementById('chartDom')
      echarts.dispose(chartDom)
      var myChart = echarts.init(chartDom)
      var option

      option = {
        tooltip: {
          show: true,
          backgroundColor: 'transparent',
          trigger: 'item',
          borderColor: 'transparent',

          // 设置tooltip的位置提示框固定在顶部居中
          position: function (point, params, dom, rect, size) {
            return [point[0] + 90, '8%']
          },

          extraCssText: 'box-shadow: 0 0 0 rgba(0, 0, 0, 0);z-index: 9', //* 修改tooltipcss自定义样式
          formatter: (params) => {
            // console.log('params', params)
            var result = ''
            try {
              params.forEach((item) => {
                result += `<div>
                <div style="margin: 0 8px;position: relative; left: -200%;}">
                  <span style="color: #6E66FA;">$${item.value}</span>
                </div>
              </div>`
              })
            } catch (error) {
              // console.log(error)
            }

            return result
          }
        },
        grid: {
          left: '-3%',
          right: '3%',
          bottom: '20%',
          containLabel: true
        },
        dataZoom: [
          {
            type: 'inside',
            throttle: 7
          }
        ],
        xAxis: [
          {
            type: 'category',
            boundaryGap: false,
            lineStyle: {
              color: 'rgba(0, 0, 0, 0)'
            },
            axisLine: {
              show: false
            },
            axisTick: {
              show: false
            },
            offset: 19.5,

            axisPointer: {
              type: 'line',
              z: 1,
              show: true,
              lineStyle: {
                color: '#6E66FA',
                width: 1
              },
              label: {
                backgroundColor: '#131314'
              }
            },

            axisLabel: {
              show: true,

              interval: 'auto' // 主要设置其间隔,间隔为3 'auto'
            },

            // show: false, // 隐藏x轴
            data: x
          }
        ],

        yAxis: [
          {
            type: 'value',
            show: false // 隐藏x轴
          }
        ],
        series: [
          {
            name: 'History',
            type: 'line',
            itemStyle: {
              normal: {
                color: '#6E66FA',
                lineStyle: {
                  // 系列级个性化折线样式
                  width: 1.5
                }
              }
            },
            // labelLayout (params) {
            //   console.log('params', params)
            //   return {
            //     x: myChart.getWidth() - 125,
            //     y: -myChart.getHeight() + 250,
            //     verticalAlign: 'middle',
            //     align: 'content'
            //   }
            // },
            // labelLayout: function () {
            //   return {
            //     x: myChart.getWidth() + 160,
            //     moveOverlap: 'shiftX',
            //     align: 'content',
            //     verticalAlign: 'middle'
            //   }
            // },
            // symbol: 'none',
            symbolSize: 0, // 标记图形的大小
            areaStyle: {
              opacity: 1,
              normal: {
                // 颜色渐变函数 前四个参数分别表示四个位置依次为左、下、右、上
                color: new echarts.graphic.LinearGradient(0, 0, 0, 1, [
                  {
                    offset: 0,
                    color: 'rgba(110, 102, 250, 0.5)'
                  },
                  {
                    offset: 1,
                    color: 'rgba(110, 102, 250, 0)'
                  },
                  {
                    offset: 1,
                    color: 'rgba(110, 102, 250, 0.2)'
                  }
                ])
              }
            }, // 区域颜色渐变

            data: y
          }
        ]
      }
      const openY = () => {
        y.forEach((item, index) => {
          // 判断数组最后一个值比倒数第二个值小的时候item.label.distance = 160
          if (index === y.length - 1) {
            item.label.show = true
            item.labelLine.show = true
            echarts.dispose(chartDom)
            this.chartLine(this.xAxisData, this.yAxisData)
            if (item.value < this.yAxisData[index - 1]) {
              item.label.distance = 90
            }
            //   console.log('mouseout', item, this.yAxisData[index - 1])
            window.addEventListener('resize', function () {
              myChart.resize()
            })
          }
        })
      }
      const closeY = () => {
        y.forEach((item, index) => {
          if (index === y.length - 1) {
            item.label.show = false
            item.labelLine.show = false
            myChart.resize()
            option && myChart.setOption(option)

            // console.log('mouseover', item)
            window.addEventListener('resize', function () {
              myChart.resize()
            })
          }
        })
      }

      var closeYFn = debounce(closeY, 500)
      var openYFn = debounce(openY, 500)
      myChart.getZr().on('mousemove', (event) => {
        if (!event.target) {
          closeYFn()
        }
      })
      myChart.getZr().on('mouseout', (event) => {
        if (!event.target) {
          openYFn()
        }
      })

      option && myChart.setOption(option)
      window.addEventListener('resize', function () {
        myChart.resize()
      })
      // 移出事件
      // myChart.on('globalout', (params) => {
      //  console.log(ylist, 'mouseout', params)
      //   openY()
      // })
    }
  }
}
</script>

<style scoped></style>
|


