????Cesium以Viewer为核心类,实现对三维要素在主窗口中的展示,同时提供了一些默认的控件,这些在Cesium-环境搭建|运行与默认控件介绍中有所涉及。Cesium也提供了对屏幕坐标系统(Cartesian2)、笛卡尔空间直角坐标系统(Cartesian3)和WGS84地理坐标系统的支持。
Cesium核心类:Viewer
Viewer:窗口基础控件
????Viewer窗口基础控件(例如:地理位置搜索、图层选择器、导航帮助按钮、时间控件、全局显示按钮等),已经在Cesium-环境搭建|运行与默认控件介绍中进行介绍。
Viewer:基本参数解释
????在前一篇文章的末尾,通过控制Viewer类的基本参数,来实现窗口基础控件的隐藏效果。Viewer视图类也还包含了一些其它可选参数。
????如下为Cesium.Viewer的初始化过程,
<!DOCTYPE html>
<html lang="en">
<head>
    <meta charset="UTF-8">
    <title>Title</title>
    <!--引入Cesium.js开发包资源-->
    <script src="../../Build/Cesium/Cesium.js"></script>
    <!--引入widgets.css开发包资源-->
    <style>
        @import url("../../Build/Cesium/Widgets/widgets.css");
        html,body,
        #viewerContainer{
            width: 100%;
            height: 100%;
            margin: 0;
            padding: 0;
            overflow: hidden;
        }
    </style>
</head>
<body>
    <div id="viewerContainer"></div>
</body>
<script>
    // Cesium.Viewer初始化参数
    const viewer = new Cesium.Viewer("viewerContainer",{
        animation:false,//动画控件-左下角的仪表盘
        baseLayerPicker:false,//图层选择器
        fullscreenButton:false,//全屏模式按钮
        geocoder:false,//地理位置搜索框
        homeButton:false,//重置为相机默认的视角
        infoBox:false,//鼠标点击显示的默认信息框
        sceneModePicker:false,//场景模式选择器
        selectionIndicator:false,//鼠标点击显示的绿框
        timeline:false,//时间轴
        navigationHelpButton:false,//导航帮助按钮
        scene3DOnly:true,//设置为true,则所有几何图形以三维模式绘制,可节省GPU资源,默认为false
        clockViewModel:new Cesium.ClockViewModel(new Cesium.Clock()),//用于控制当前时间的时钟对象
        /**
         * imageryProvider 设置底图图层,仅在baseLayerPicker设置为false时有效
         * Cesium.createWorldImagery()-创建CesiumION默认提供的影像-默认是Bing地图
         */
        imageryProvider:Cesium.createWorldImagery({
            /**
             * 支持三种style
             *  [1]Cesium.IonWorldImageryStyle.AERIAL-航空影像风格
             *  [2]Cesium.IonWorldImageryStyle.AERIAL_WITH_LABELS-带有道路的航空影像风格
             *  [3]Cesium.IonWorldImageryStyle.AERIAL-仅有道路的风格(无额外航空影像)
             */
            style:Cesium.IonWorldImageryStyle.AERIAL,
        }),//
        /**
         * terrainProvider-设置地形图层-地形图层实例决定了瓦片如何附着在三维球体表面上-仅在baseLayerPicker设置为false时有效
         * new Cesium.EllipsoidTerrainProvider(options)-直接将geometry贴在三维球体表面上
         */
        terrainProvider:new Cesium.EllipsoidTerrainProvider({
            // tilingScheme:new Cesium.TilingScheme(),//以4*4的形式剖分瓦片
            ellipsoid:Cesium.Ellipsoid.WGS84,//WGS84坐标系(当参数tilingScheme被指定时,此参数ellipsoid会被忽略)
        }),
        /**
         * skybox-默认显示星空|太阳|月亮-如果设置为false,则不会显示前三者
         *      也可以自定义天空盒背景
         */
        skyBox:false,
        fullscreenElement:document.body,//全屏时渲染的html元素
        useDefaultRenderLoop:true,//开启循环渲染
        targetFrameRate:undefined,//使用默认循环渲染时的帧率
        showRenderLoopErrors:false,//是否显示循环渲染的错误信息,false不显示,默认为true
        automaticallyTrackDataSourceClocks:true,//自动追踪最近添加的数据源时钟设置
        contextOptions:undefined,//传递给scene对象的上下文参数
        sceneMode:Cesium.SceneMode.SCENE3D,//初始场景模式
        mapProjection:new Cesium.WebMercatorProjection(Cesium.Ellipsoid.WGS84),//2维或者哥伦布视图模式下的投影坐标系统
        dataSources:new Cesium.DataSourceCollection(),//可视化时存储数据源的容器
    });
    //隐藏底部版权图标信息
    viewer._cesiumWidget._creditContainer.style.display="none";
</script>
</html>
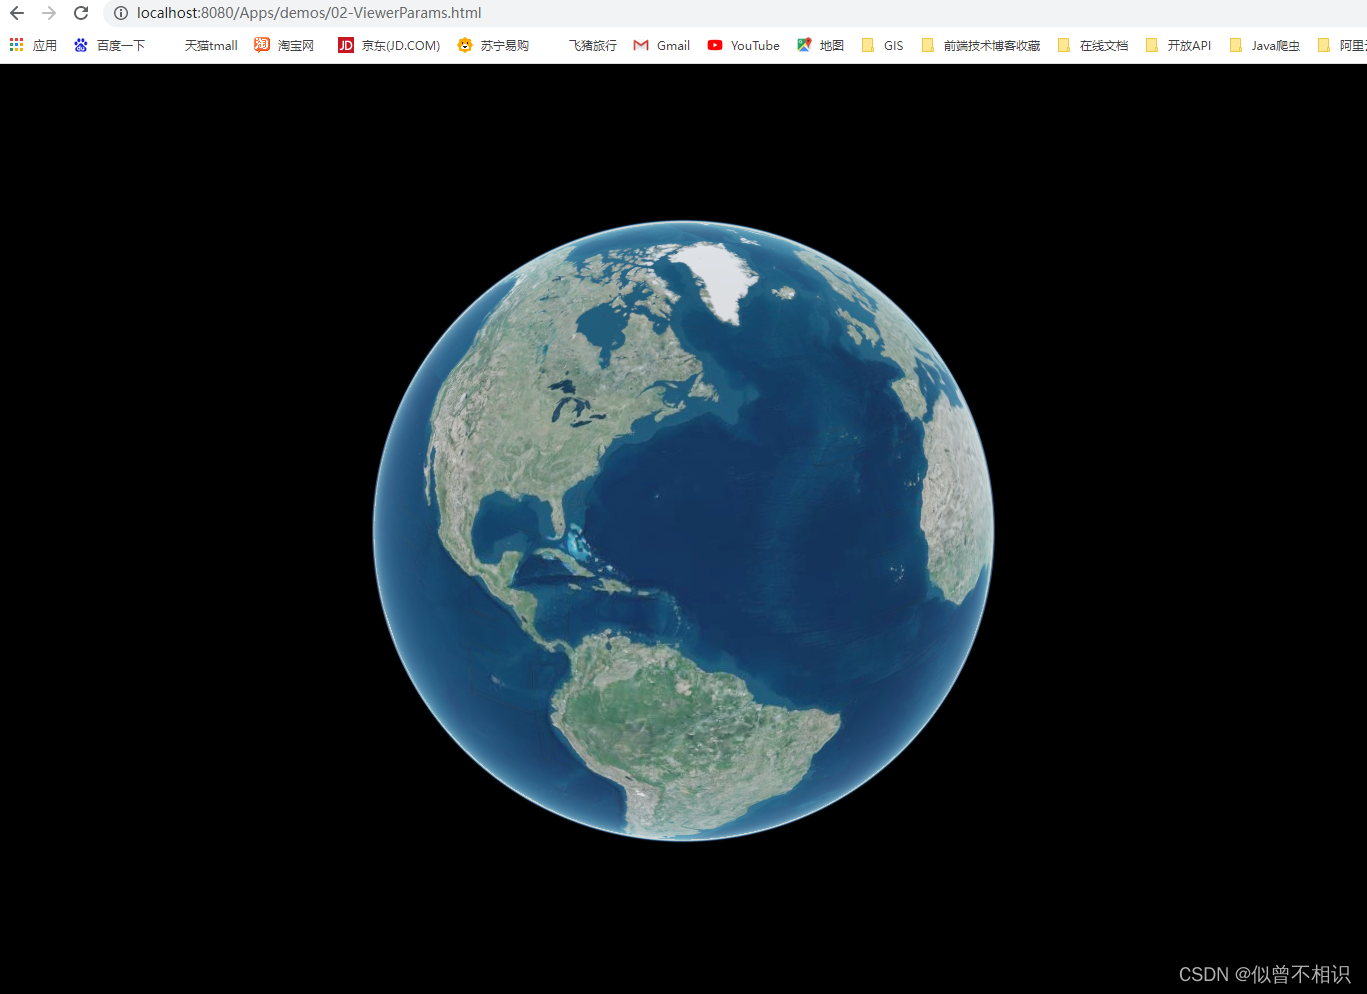
Viewer:Scene场景类
????Scene是构建可视的三维场景的类,Cesium开发的大部分工作都在Scene场景中执行,包括:调用图层、3D Tiles数据加载、场景交互等,其主要包括4个部分:
????????①基础地理环境设置:如地球参数(globe)、光照(light)、雾(fog)、大气(skyAtmosphere)等;
????????②基础图层设置,分为底图图层和地形图层等。注:viewer.imageryLayers==viewer.scene.imageryLayers,两者是等价的。
????????③场景数据绘制:Cesium中的场景数据绘制底层是依赖Primitive的,通过Primitive。开发者可以通过图形学原理,自定义一些高级图形;同时,Cesium也基于Primitive接口,提供了高度封装的Entity实体类,用于实现一些常用图形的绘制。
????????④场景交互函数:例如,pick(鼠标事件)、camera(相机事件)。注:viewer.camera == viewer.scene.camera。
Entity|DataSource数据源
Viewer:Entity实体类
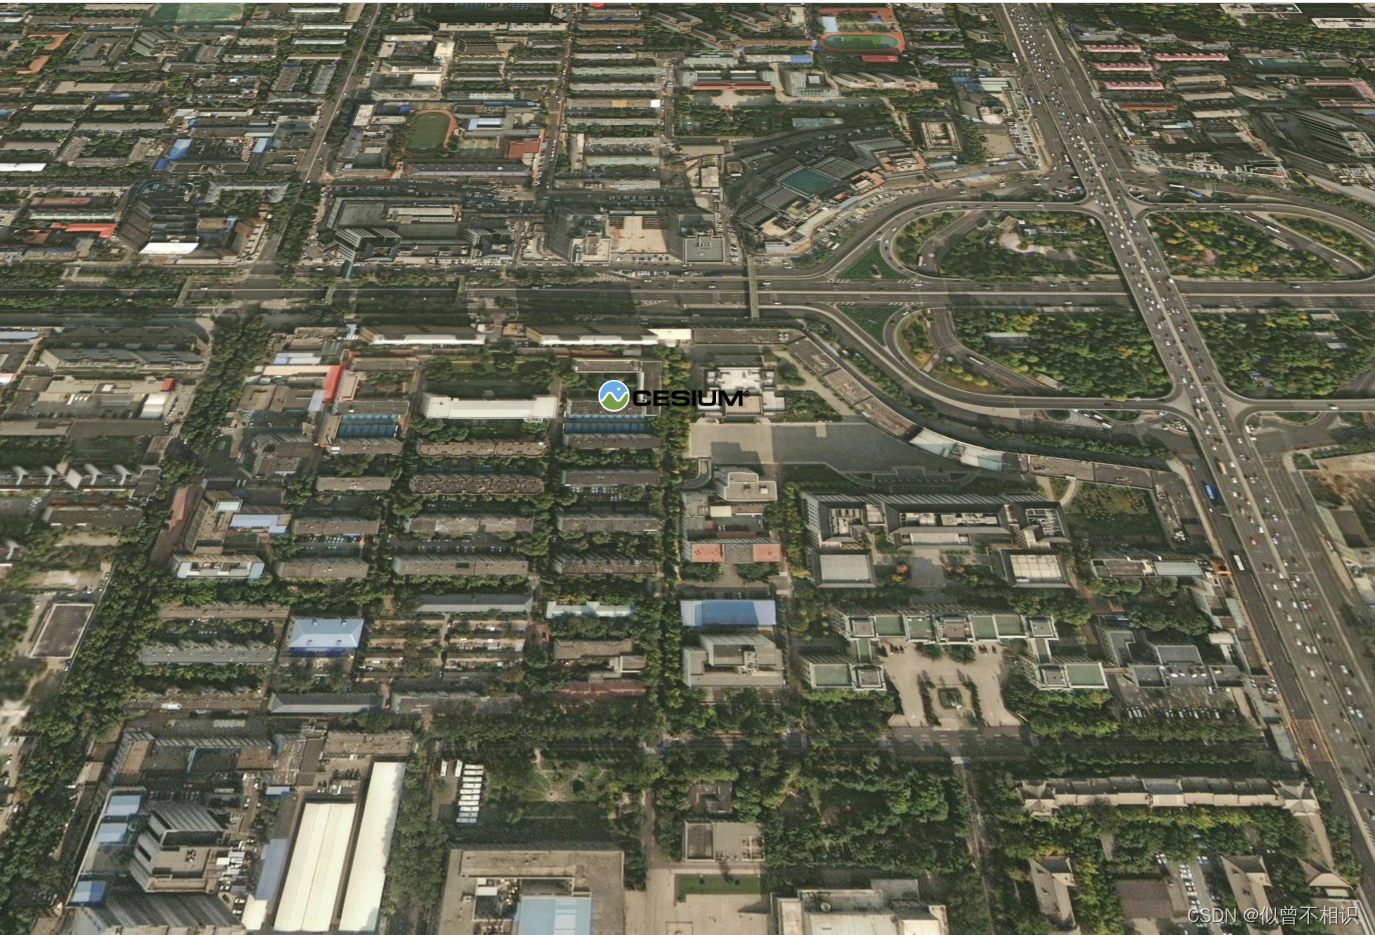
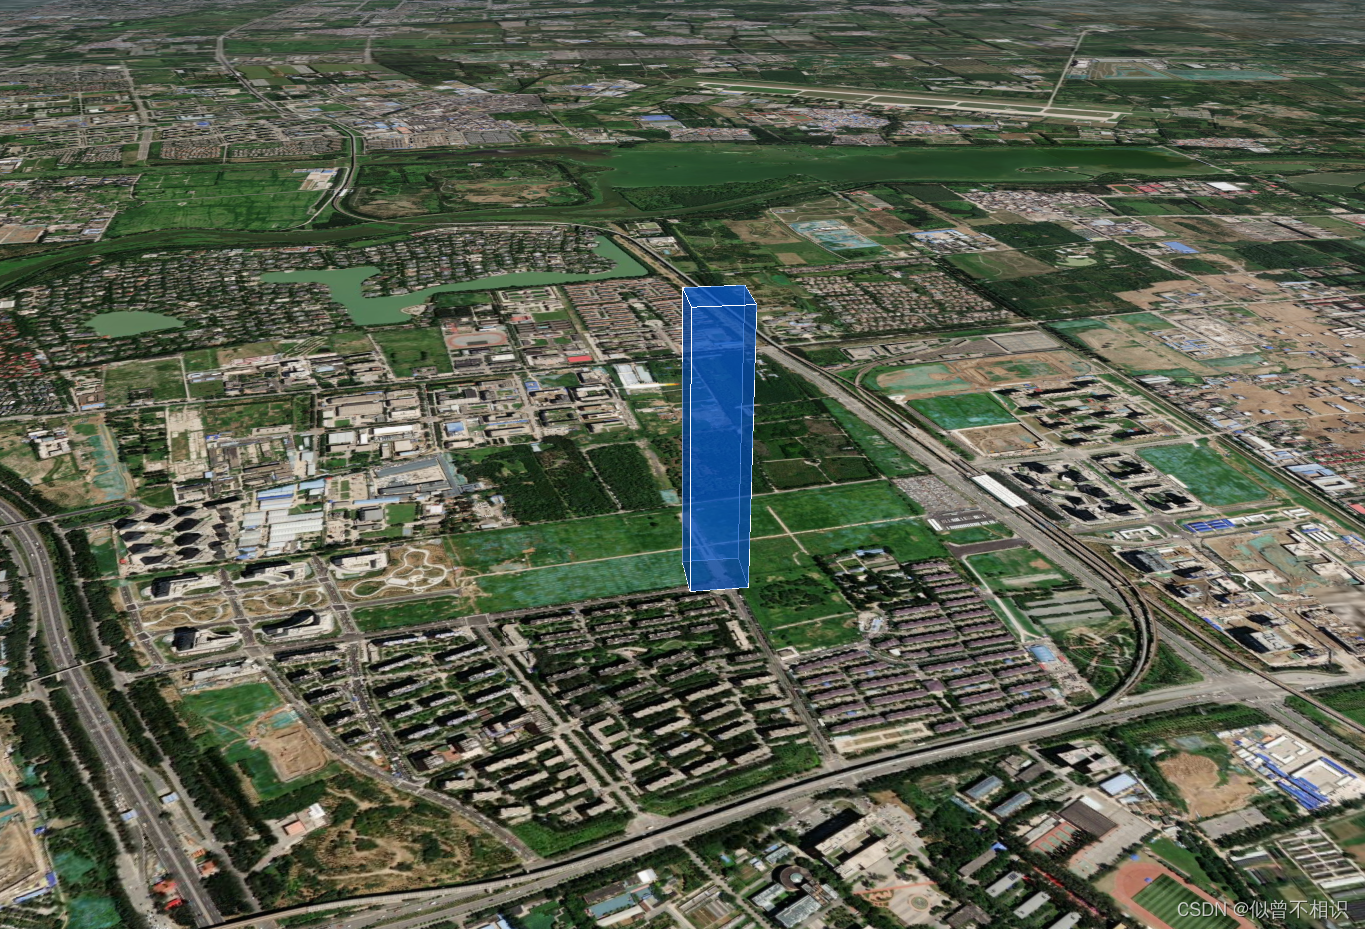
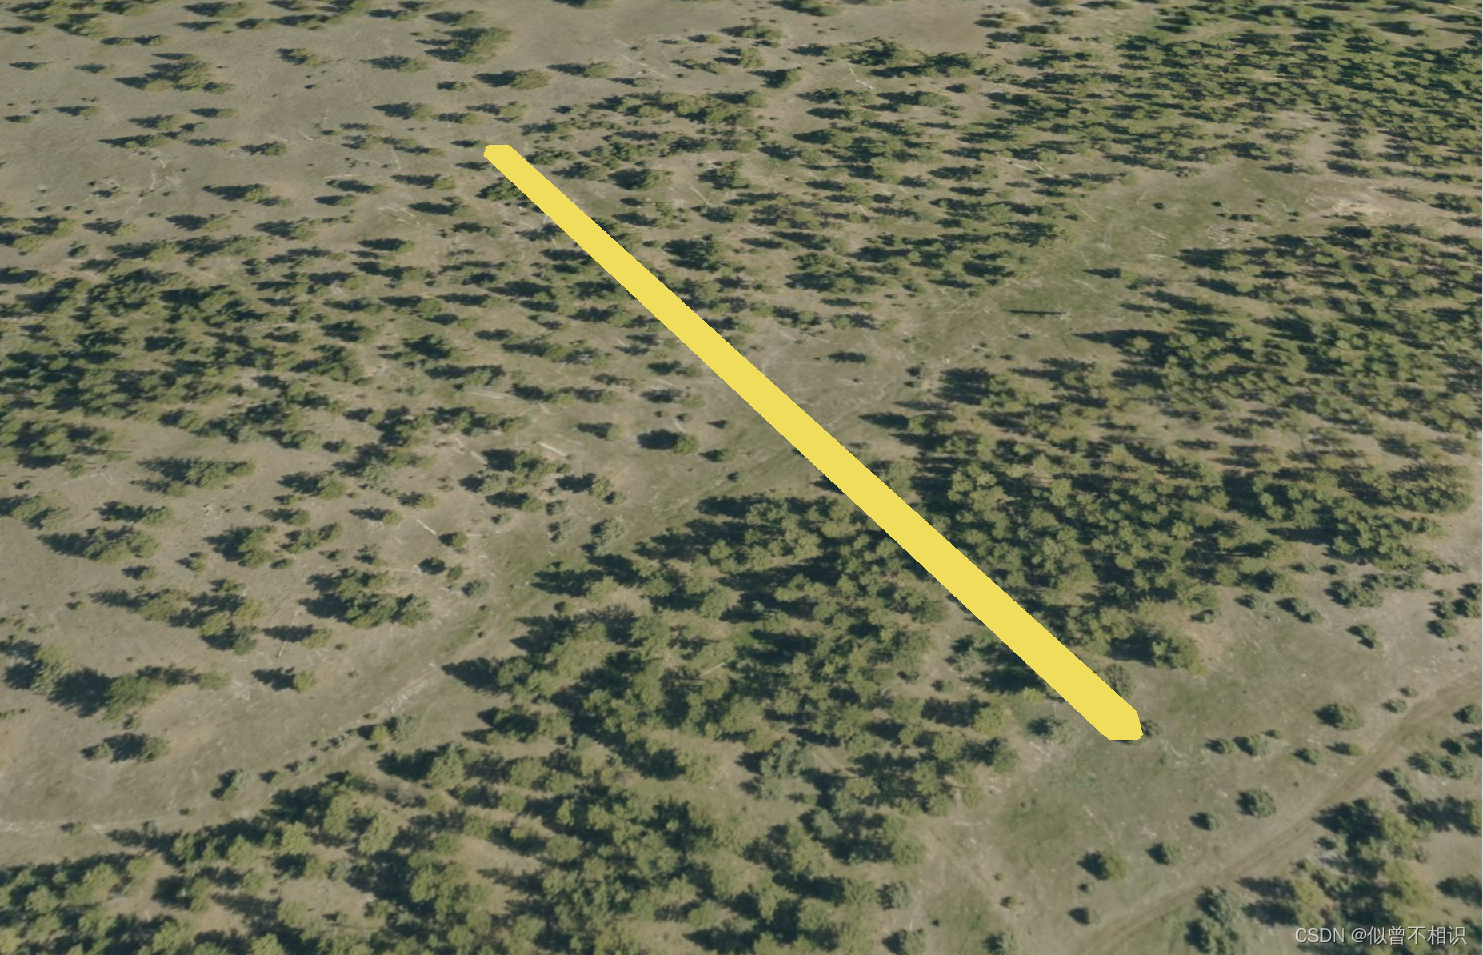
????Entity实体底层是基于Primitive图元进行封装的,它可以手动指定参数创建,也可以基于czml或者geojson数据源进行创建,然后被添加到Viewer的entities属新中,但是Entity并不属于Scene场景实例。相比Primitive,Entity提供的图形更加丰富,可以使得在开发时,更加关注数据本身,而无需关注底层的可视化机制。在简单三维场景开发中,Entity的使用频率要高于Primtive。
????构造Entity的示例代码如下,
<!DOCTYPE html>
<html lang="en">
<head>
    <meta charset="UTF-8">
    <title>Entity-实体</title>
    <!--引入Cesium开发包资源-->
    <script src="../../Build/Cesium/Cesium.js"></script>
    <!--引入Cesium样式资源-->
    <style>
        @import url("../../Build/Cesium/Widgets/widgets.css");
        html,body,
        #viewerContainer{
            width: 100%;
            height: 100%;
            margin: 0;
            padding: 0;
            overflow: hidden;
        }
    </style>
</head>
<body>
    <div id="viewerContainer"></div>
</body>
<script src="./utils/initCesiumViewer.js"></script>
<script src="./utils/buildEntityUtil.js"></script>
<script>
    const viewer = initCesiumViewer("viewerContainer");
    //添加point实体
    var pointEntity =viewer.entities.add(
        buildBasicEntityUtil(viewer,"point",{
            id:"point",
            name:"point",
            show:true,
            position:Cesium.Cartesian3.fromDegrees(116.3, 39.9, 0),
            attributes:{
                id:10000,
                type:"报警点",
                level:5,
                msg:"洪水预警",
            },
            pointParams:{
                pixelSize:25,
                heightReference:Cesium.HeightReference.NONE,
                color:Cesium.Color.BLACK,
                distanceDisplayCondition:new Cesium.DistanceDisplayCondition(0.0, Number.MAX_VALUE),
            }
        })
    );
    var billboardEntity = viewer.entities.add(
        buildBasicEntityUtil(viewer,"billboard",{
            id:"billboard",
            name:"billboard",
            show:true,
            position:Cesium.Cartesian3.fromDegrees(116.3, 39.9, 500),
            attributes:{
                id:10000,
                type:"报警点",
                level:5,
                msg:"洪水预警",
            },
            billboardParams:{
                image: "./images/CesiumLogo.png",
                scale: 0.8,
                width: 190,
                heigth: 40,
                heightReference:Cesium.HeightReference.NONE,
                color:Cesium.Color.BLACK,
                distanceDisplayCondition:new Cesium.DistanceDisplayCondition(0.0, Number.MAX_VALUE),
            }
        })
    )

    var boxEntity = viewer.entities.add(
        buildBasicEntityUtil(viewer,"box",{
            id:"box",
            name:"box",
            show:true,
            position:Cesium.Cartesian3.fromDegrees(116.3, 40.1, 300),
            attributes:{
                id:10000,
                type:"报警点",
                level:5,
                msg:"洪水预警",
            },
            boxParams:{
                dimensions: new Cesium.Cartesian3(100, 100, 500),//控制长宽高属性
                fill: true,
                outline: true,
                outlineColor: Cesium.Color.WHITE,
                outlineWidth: 2,
                material: Cesium.Color.fromRandom({ alpha: 0.5 }),
            }
        })
    )

    var corridorEntity = viewer.entities.add(
        buildBasicEntityUtil(viewer,"corridor",{
            id:"corridor",
            name:"corridor",
            show:true,
            // position:Cesium.Cartesian3.fromDegrees(115.3, 40.1, 300),
            attributes:{
                id:10000,
                type:"报警点",
                level:5,
                msg:"洪水预警",
            },
            corridorParmas: {
                positions: Cesium.Cartesian3.fromDegreesArray([-120.0, 45.0, -120.001, 45.001, -120.002, 45.002, ]),
                width: 10,
                material: Cesium.Color.fromRandom({ alpha: 1.0 }),
            },
        })
    )

    var ellipseEntity = viewer.entities.add(
        buildBasicEntityUtil(viewer,"ellipse",{
            id: "ellipse",
            name: "ellipse",
            show: true, // 是否显示
            position: Cesium.Cartesian3.fromDegrees(115.3, 34.9, 500),
            ellipseParams: {
                semiMinorAxis: 3000.0,
                semiMajorAxis: 5000.0,
                heightReference: Cesium.HeightReference.NONE,
                height: 500,//如果不设置height,即使position指定了高度-它也是贴地的
                material: Cesium.Color.fromRandom({ alpha: 1.0 }),
            },
            type: "mime_ellipse",
        })
    )

    var ellipsoidEntity = viewer.entities.add(
        buildBasicEntityUtil(viewer,"ellipsoid",{
            id: "ellipsoid",
            name: "ellipsoid",
            show: true, // 是否显示
            position: Cesium.Cartesian3.fromDegrees(118.3, 36.9, 100),
            ellipsoidParams: {
                radii: new Cesium.Cartesian3(1000.0, 1000.0, 1000.0),//radii-分别用于控制长短半轴+拉伸高度
                outline: true,
                outlineColor: Cesium.Color.WHITE,
                outlineWidth: 2,
                material: Cesium.Color.RED.withAlpha(0.4),
            },
        })
    )

    var labelEntity = viewer.entities.add(
        buildBasicEntityUtil(viewer,"label",{
            id: "label",
            name: "label",
            show: true, // 是否显示
            position: Cesium.Cartesian3.fromDegrees(119.3, 33.9, 0),
            labelParams:{
                text:"文字注记",
                backgroundColor:Cesium.Color.ORANGERED,
            }
        })
    )

    var modelEntity = viewer.entities.add(
        buildBasicEntityUtil(viewer,"model",{
            id: "model",
            name: "model",
            show: true, // 是否显示
            position: Cesium.Cartesian3.fromDegrees( -123.0744619, 44.0503706, 5000),
            modelParams:{
                uri: "./models/Cesium_Air.glb",
                scale:1.0,
                minimumPixelSize: 128,
                maximumScale: 20000,
            }
        })
    )

    // var tilesetEntity = viewer.entities.add(
    //     buildBasicEntityUtil(viewer,"tileset",{
    //         id: "tileset",
    //         name: "tileset",
    //         show: true, // 是否显示
    //         tilesetParams:{
    //             show:true,
    //             uri:"http://localhost:8010/builds_height_notexture/tileset.json",
    //         }
    //     })
    // );

    var planeEntity = viewer.entities.add(
        buildBasicEntityUtil(viewer,"plane",{
            id: "plane",
            name: "plane",
            show: true, // 是否显示
            position:Cesium.Cartesian3.fromDegrees(100.0, 40.0, 0.0),
            planeParams: {
                plane: new Cesium.Plane(
                    //参数1-定义Plane平面所在的平面xy、yz、xz
                    Cesium.Cartesian3.UNIT_Z, 0.0),//当前指定位于xy平面上-不贴地
                dimensions: new Cesium.Cartesian2(400000.0, 300000.0),
                material: Cesium.Color.RED.withAlpha(0.5),
                outline: true,
                outlineColor: Cesium.Color.BLACK,
            },
        })
    )

    console.log(Cesium.Cartesian3.fromDegreesArray([
        127.0, 45.0,
        127.5, 45.5,
        128.0, 50.5,
    ]));

    var polylineEntity = viewer.entities.add(
        buildBasicEntityUtil(viewer,"polyline",{
            id: "polyline",
            name: "polyline",
            show: true, // 是否显示
            // position: Cesium.Cartesian3.fromDegreesArray([
            //     127.0,45.0,
            //     127.5,45.5,
            //     128.0,50.5,
            // ]),
            polylineParams:{
                positions:  Cesium.Cartesian3.fromDegreesArray([
                    127.0,45.0,
                    127.5,45.5,
                    128.0,50.5,
                ]),
                width: 5,
                material: Cesium.Color.RED,
                clampToGround:true,
            }
        })
    )

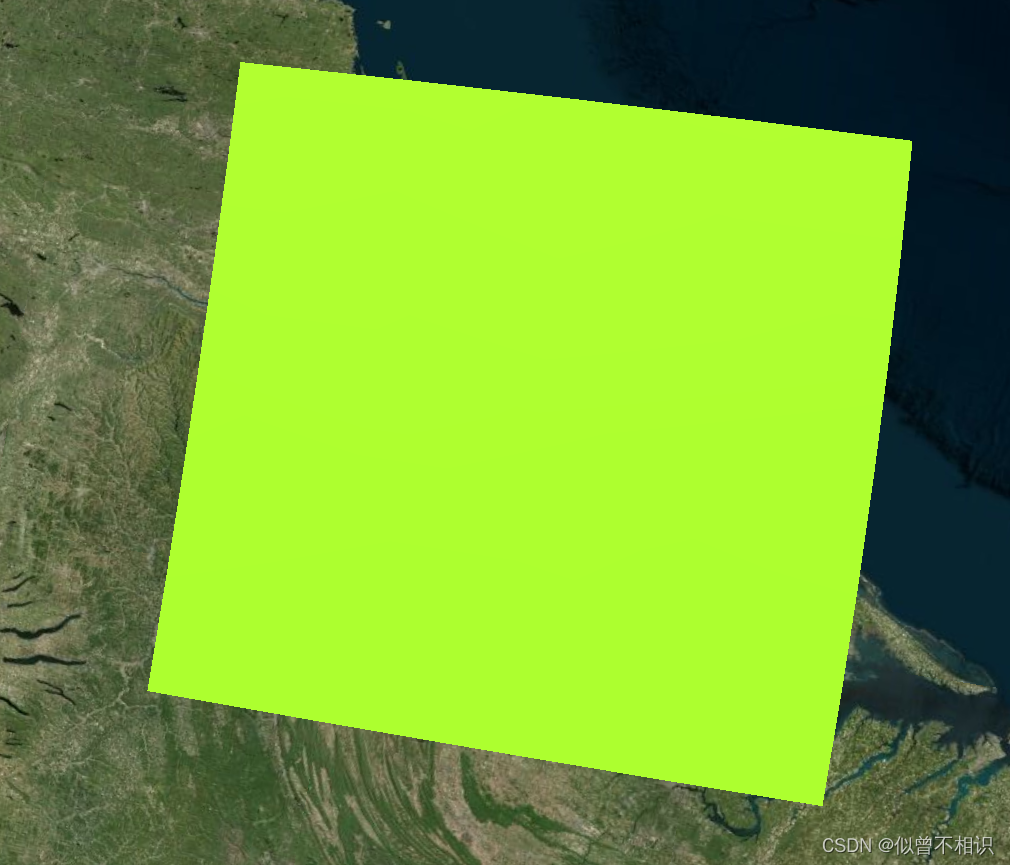
    var rectangleEntity = viewer.entities.add(
        buildBasicEntityUtil(viewer,"rectangle",{
            id: "rectangle",
            name: "rectangle",
            show: true, // 是否显示
            rectangleParams:{
                height:1500,
                //通过经纬度坐标定义矩形Rectangle
                coordinates:Cesium.Rectangle.fromDegrees(
                    -77.0,38.0,-72.0,42.0
                ),
                fill:true,
                material:Cesium.Color.GREENYELLOW
            }
        })
    )

    var polygonEntity = viewer.entities.add(
        buildBasicEntityUtil(viewer,"polygon",{
            id: "polygon",
            name: "polygon",
            show: true, // 是否显示
            polygonParams:{
                height:500,
                //从弧度转换过来的世界坐标点Cartesian3数组
                positions: Cesium.Cartesian3.fromRadiansArray([
                    -1.3194369277314022,
                    0.6988062530900625,
                    -1.3193955980204217,
                    0.6988091578771254,
                    -1.3193931220959367,
                    0.698743632490865,
                    -1.3194358224045408,
                    0.6987471965556998,
                ]),
                fill:true,
                //通过ColorMaterialProperty,利用CSS-16进制颜色定义材质
                material:new Cesium.ColorMaterialProperty(Cesium.Color.fromCssColorString("#6495ED")),
                clampToGround:true,//贴地
            }
        })
    )

    const thick = 250,
        height = 5000;
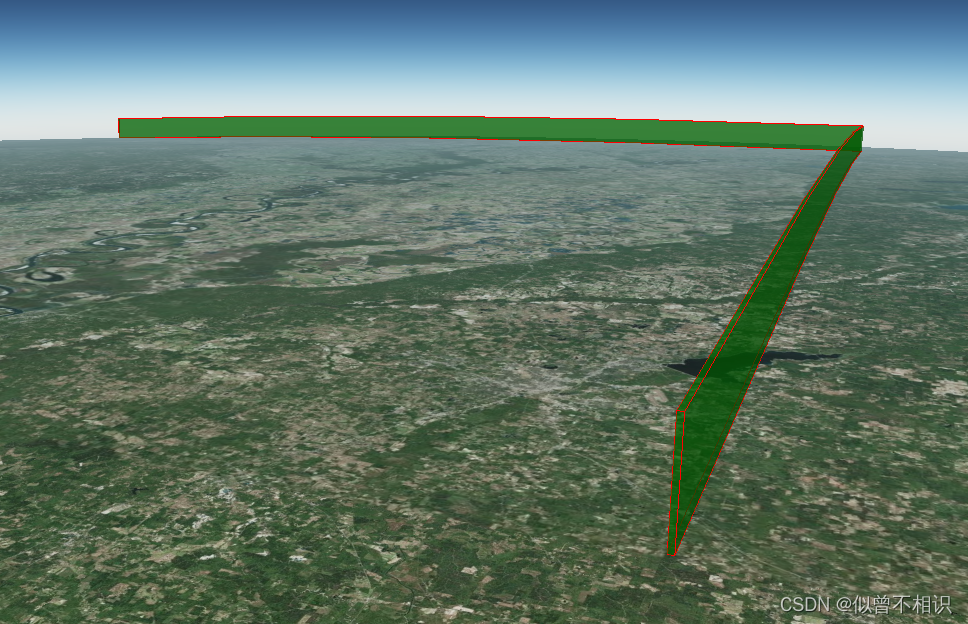
    var polylineVolumeEntity = viewer.entities.add(
        buildBasicEntityUtil(viewer,"polylineVolume",{
            id: "polylineVolume",
            name: "polylineVolume",
            show: true, // 是否显示
            polylineVolumeParams:{
                positions: Cesium.Cartesian3.fromDegreesArrayHeights([
                    -90.0,
                    32.0,
                    0.0,
                    -90.0,
                    36.0,
                    0.0,
                    -94.0,
                    36.0,
                    0.0,
                ]),
                shape: [
                    new Cesium.Cartesian2(-thick, -height),
                    new Cesium.Cartesian2(thick, -height),
                    new Cesium.Cartesian2(thick, height),
                    new Cesium.Cartesian2(-thick, height),
                ],
                material: Cesium.Color.GREEN.withAlpha(0.5),
                outline: true,
                outlineColor: Cesium.Color.RED,
            }
        })
    )


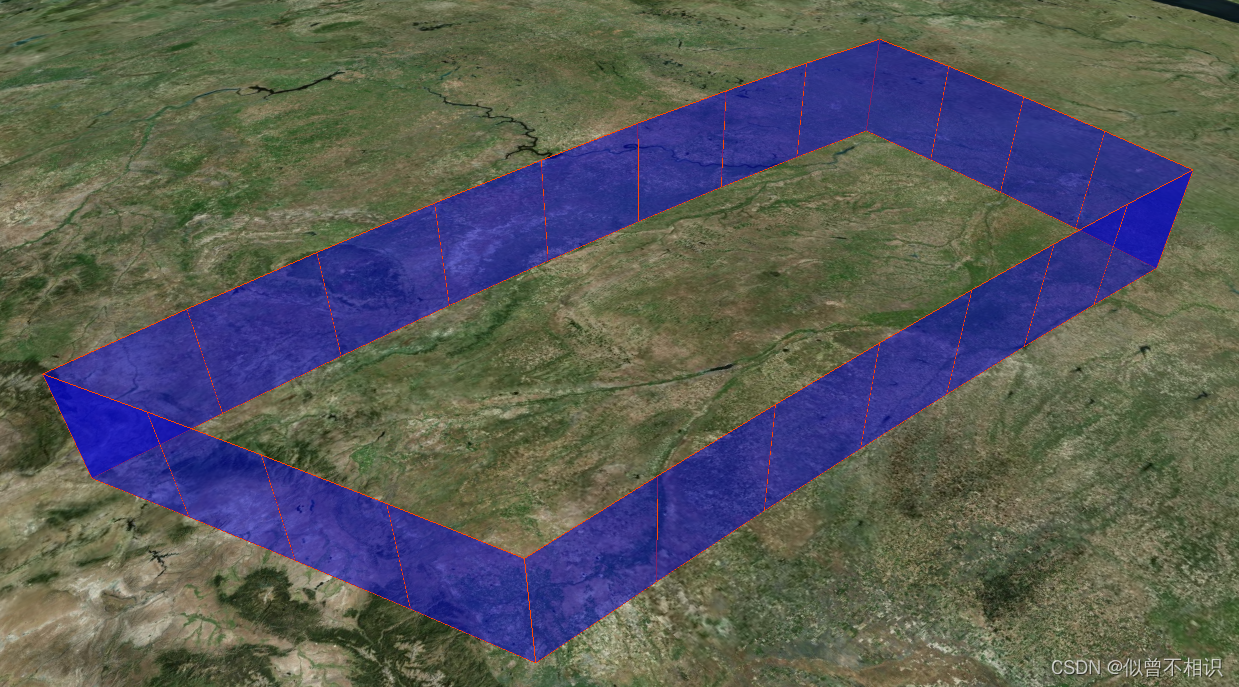
    var wallEntity = viewer.entities.add(
        buildBasicEntityUtil(viewer,"wall",{
            id: "wall",
            name: "wall",
            show: true, // 是否显示
            wallParams:{
                positions: Cesium.Cartesian3.fromDegreesArrayHeights([
                    -107.0,
                    43.0,
                    100000.0,
                    -97.0,
                    43.0,
                    100000.0,
                    -97.0,
                    40.0,
                    100000.0,
                    -105.0,
                    40.0,
                    100000.0,
                    -107.0,
                    43.0,
                    100000.0,
                ]),
                material: Cesium.Color.BLUE.withAlpha(0.5),
                outline: true,
                outlineColor: Cesium.Color.ORANGERED,
            }
        })
    )

    console.log(wallEntity)
    viewer.zoomTo(wallEntity);

</script>
</html>
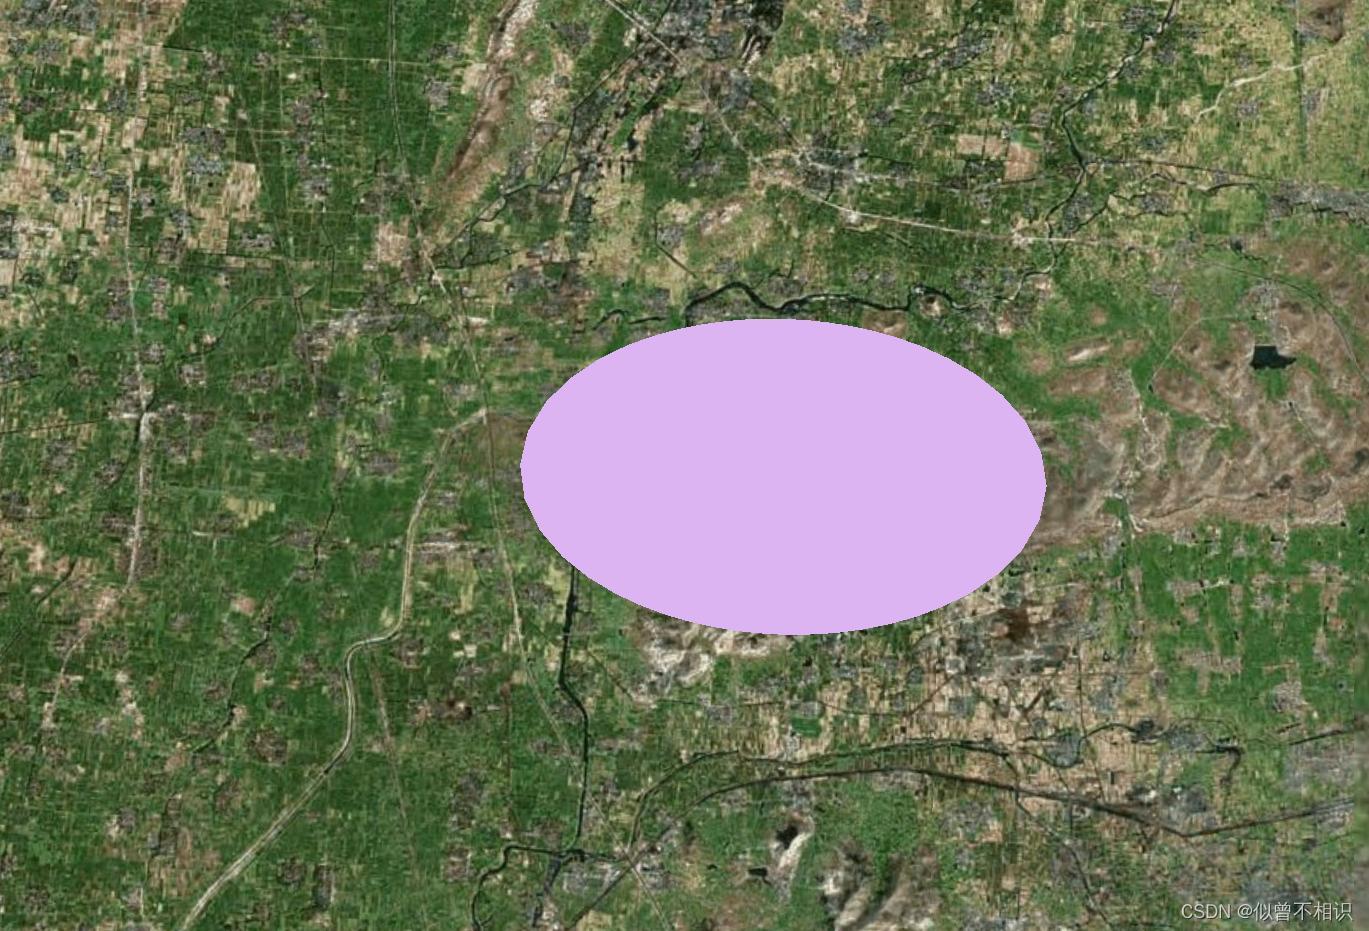
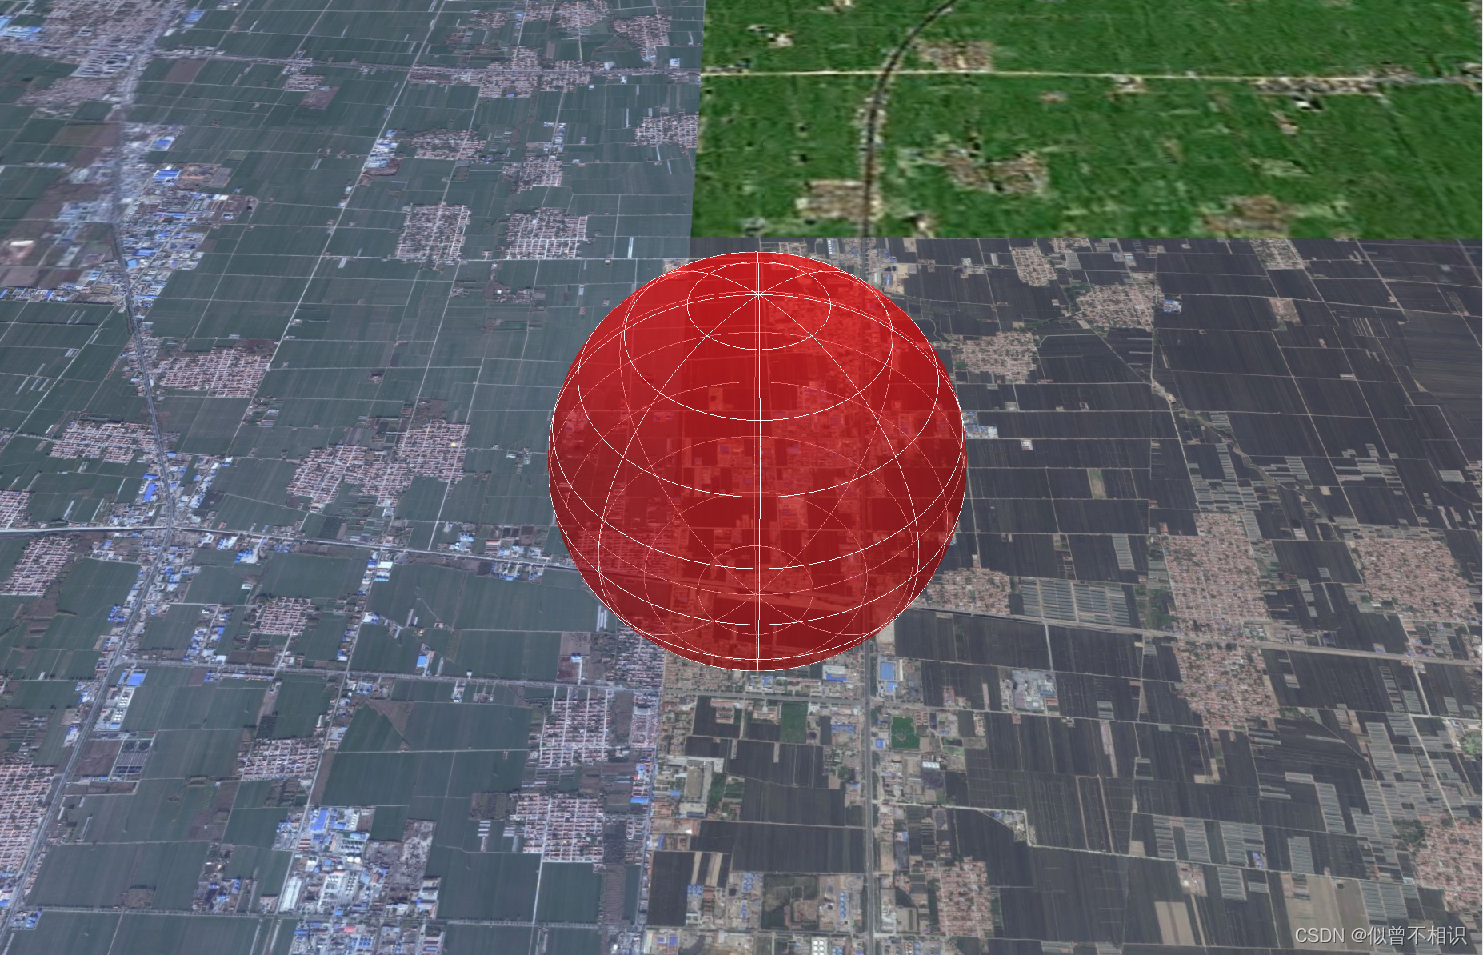
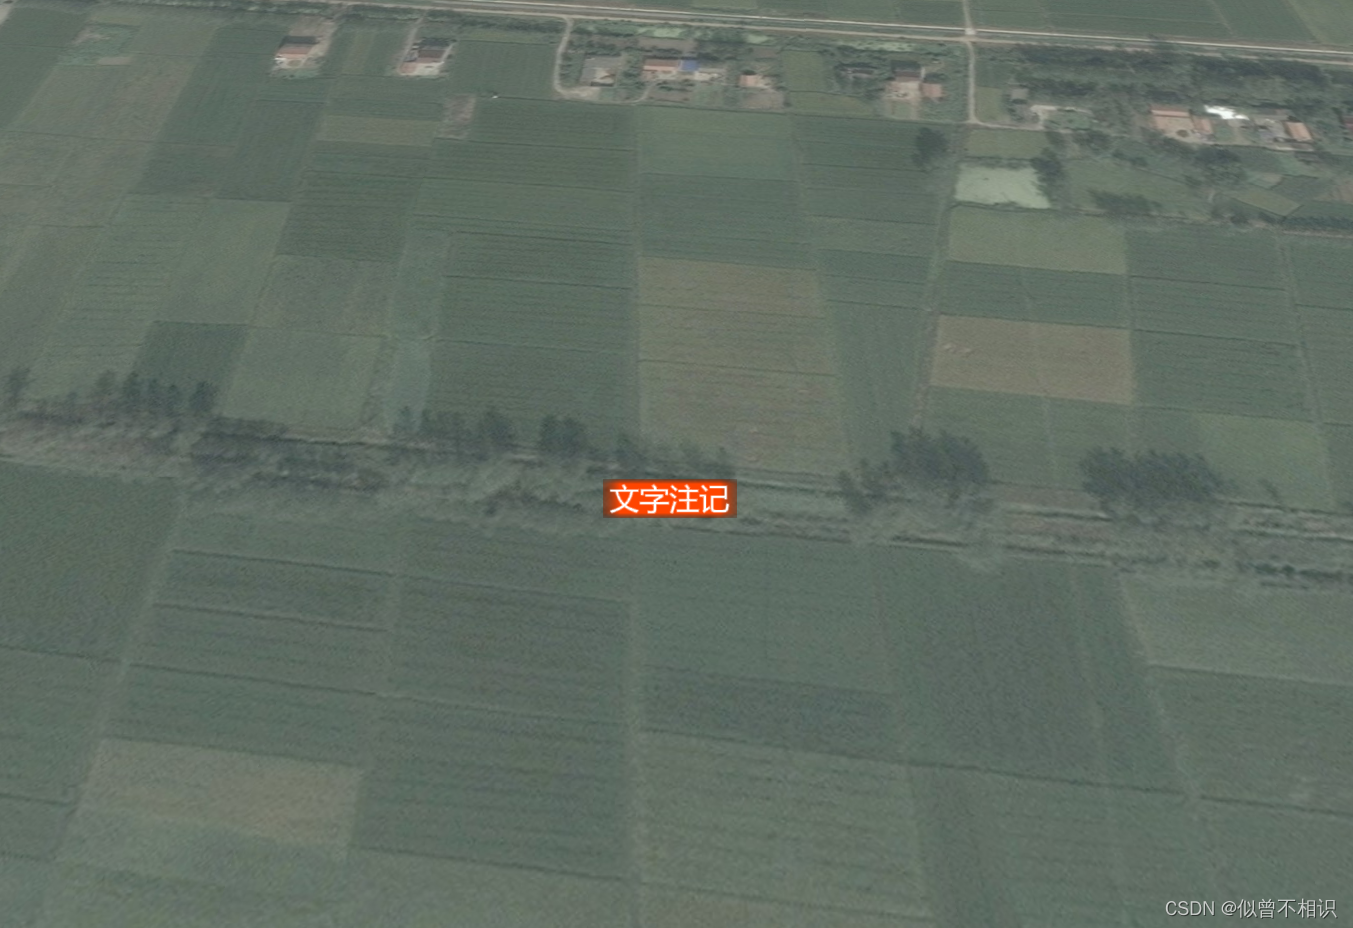
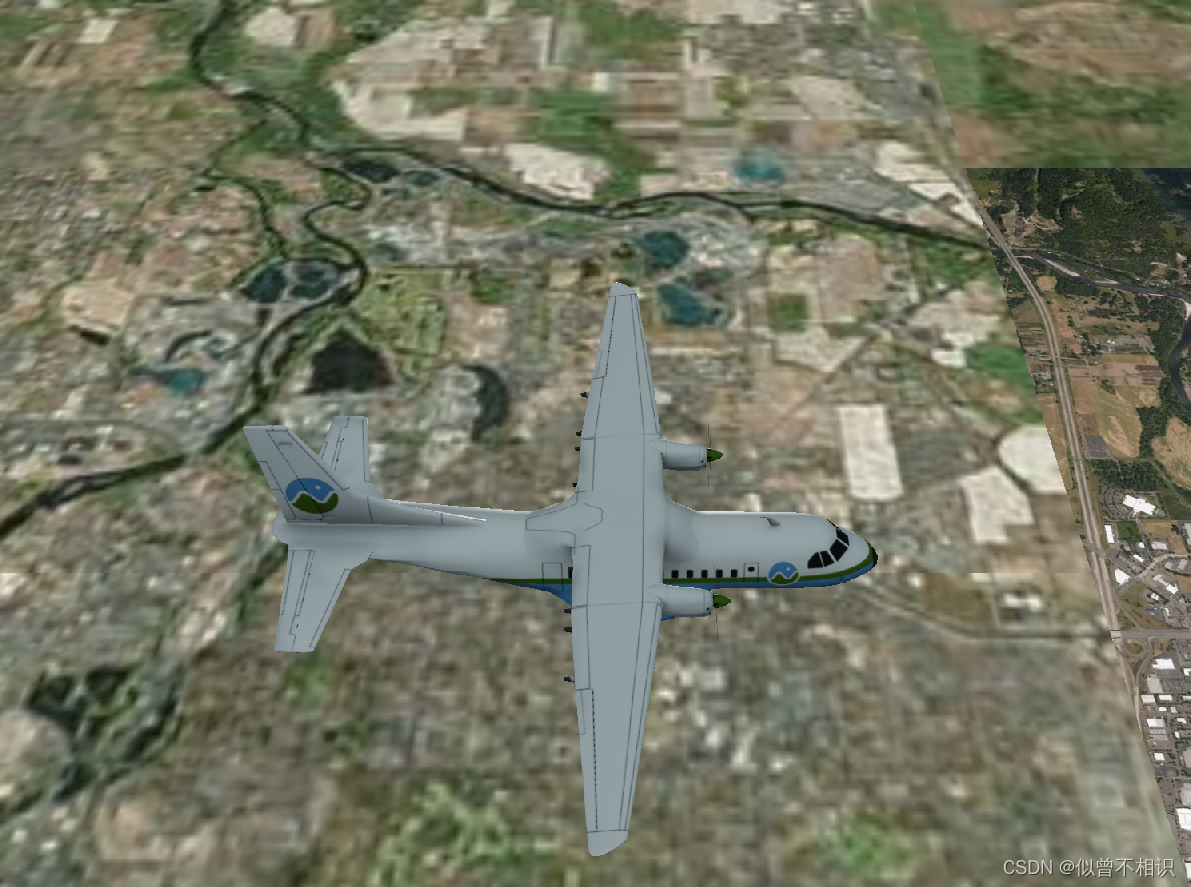
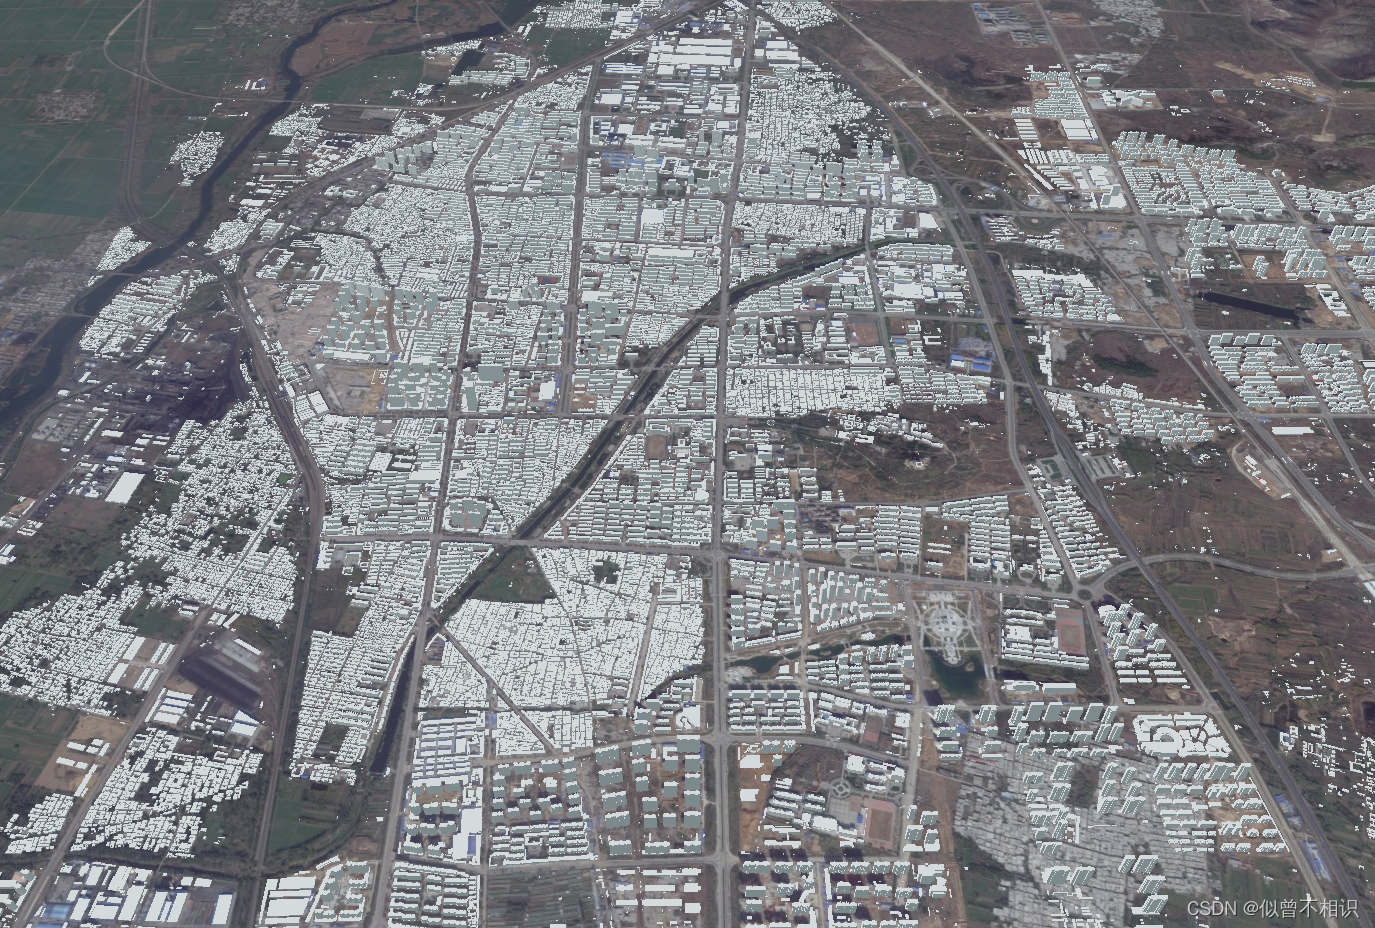
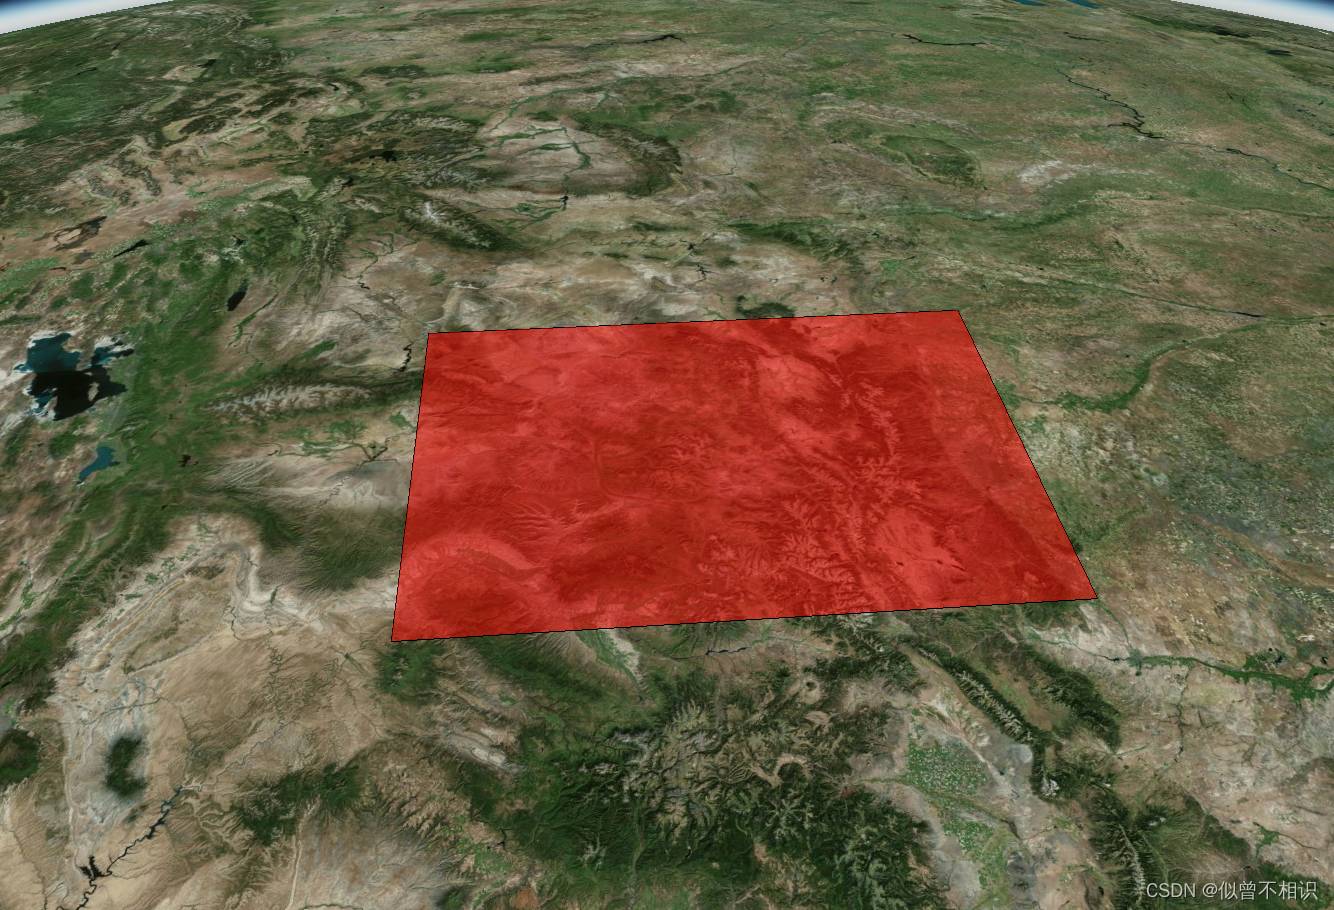
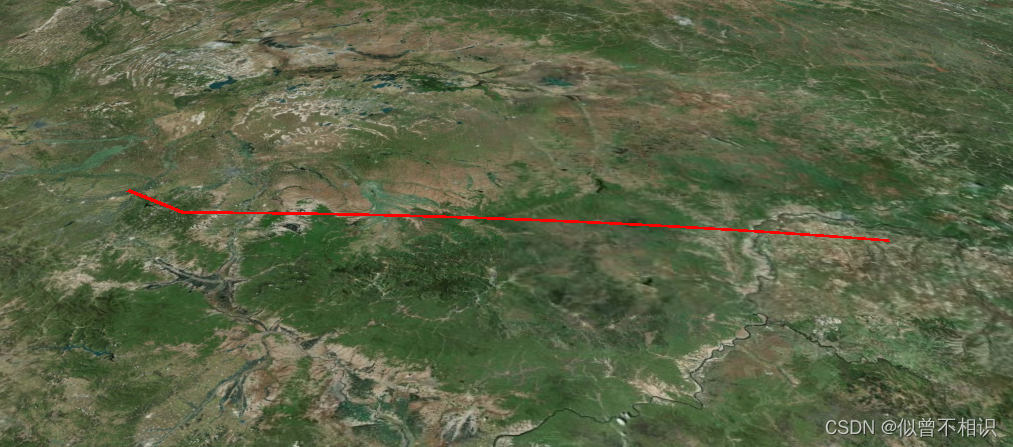
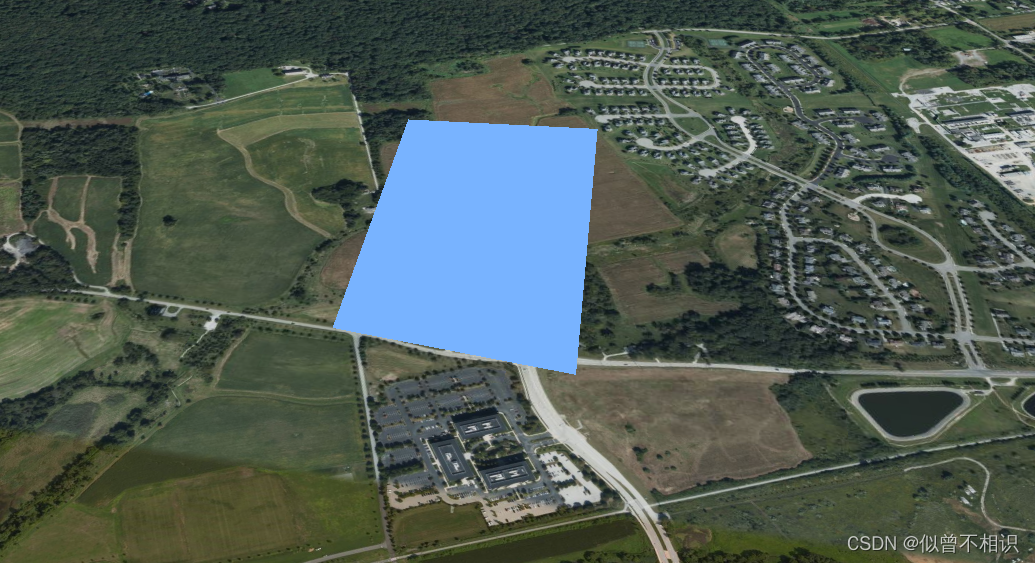
Viewer:DataSourceCollection数据源集合
????DataSourceCollection是Cesium中加载矢量数据的主要方式之一,最大特点是支持加载矢量数据集与外部文件的调用,主要分为:CzmlDataSource、KmlDataSource、GeoJsonDataSource三种,分别对应加载CZML、KML和GeoJSON格式的数据。
CzmlDataSource:Czml数据源
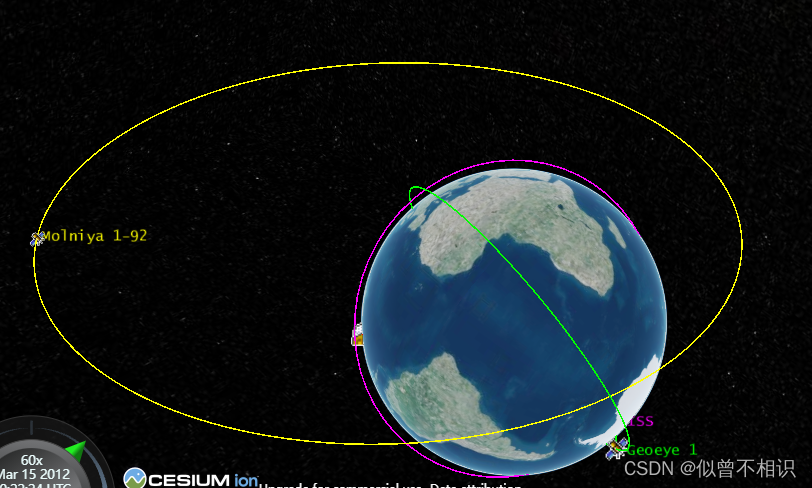
????Cesium官方给出的czml数据源加载的例子,是卫星绕地球运动,官方对CZML这种数据格式也做出了解释(可点击此处查看)。
????CZML也是一种JSON数据格式,主要用于在web浏览器上展示时态数据。在czml文件内部,可定义线、点、billboard、model和其它图元,并定义其如何随着时间发生变化。其内容样例如下。
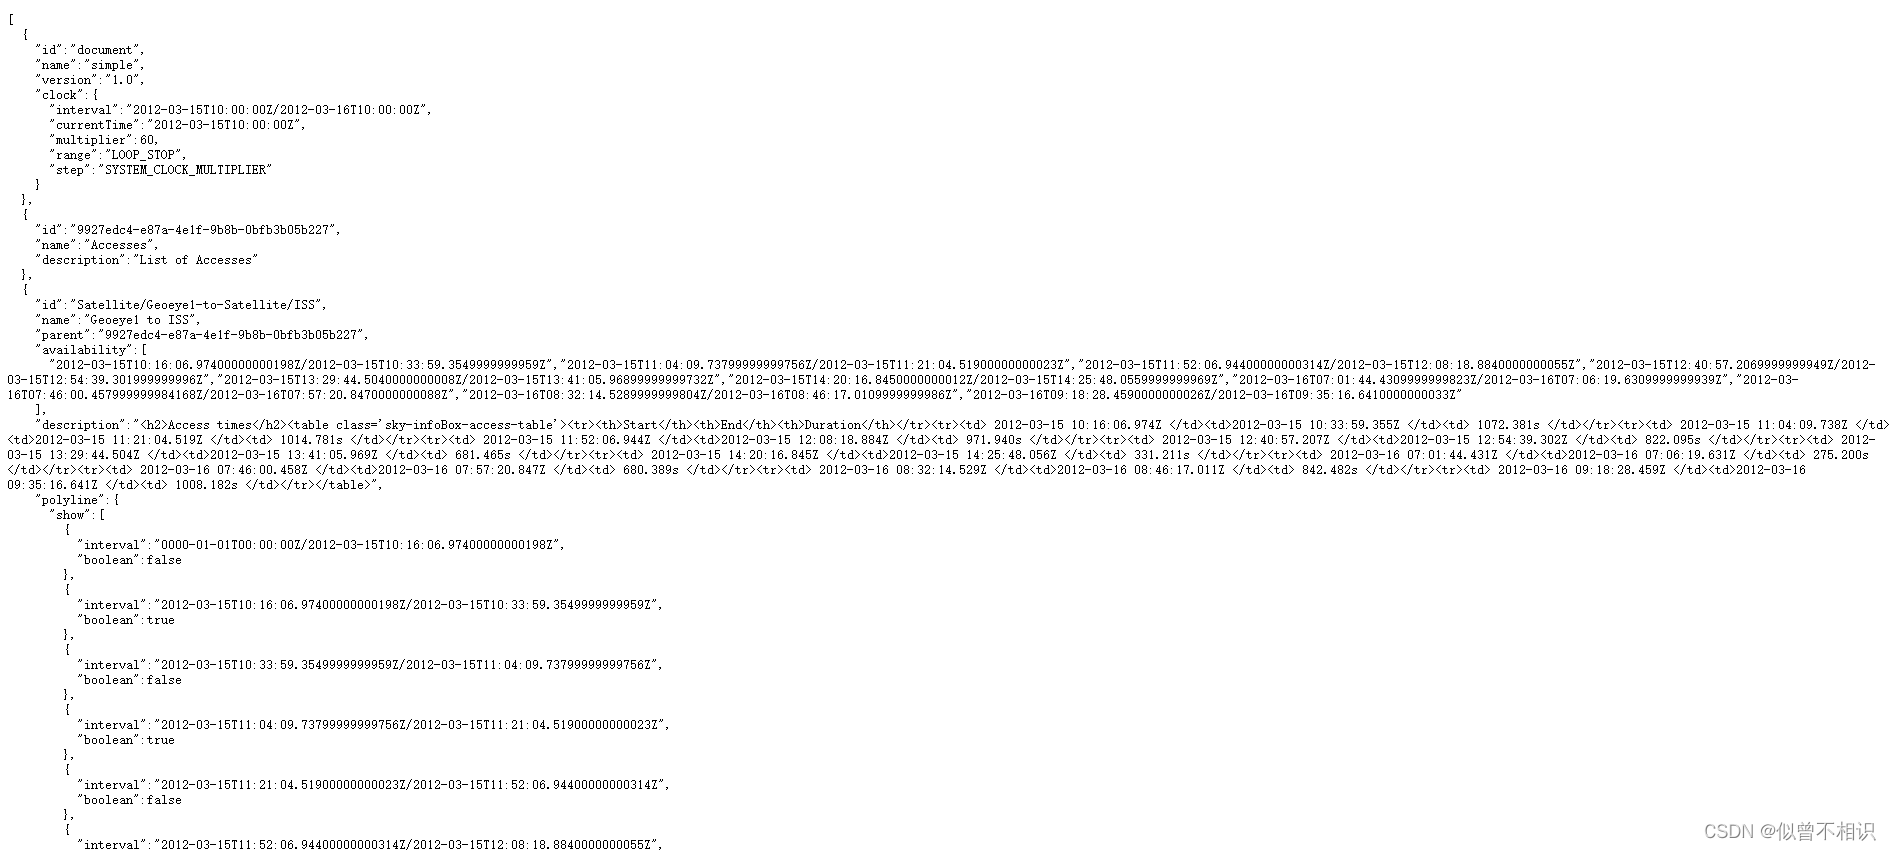 ????基于Cesium丰富的客户端API,可以实现无代码编写的,而是通过czml数据源驱动Viewer视图场景发生变化。CZML数据源特点是:
????????①CZML基于JSON数据格式,具体可查看CZML-structure;
????????②CZML可以精确描述随时间变化的属性值。例如:在一段时间内,一条线color属性为red,而在另一段时间内,这条线的color属性为blue,除此之外,客户端还可对带有时间标签的样本进行插值。如果一辆汽车在两个时间点具有不同的位置,那么客户端可以基于CZML-特定的插值算法,来精确描述这两个时间点之间,汽车应当所在的位置信息。因此,可认为CZML数据源属于时态数据的一种实现方式;
????????③CZML是为高效、增量流式传输到客户端而构建的。这意味着,客户端可以边展示边加载CZML数据源,而无需在展示之前全部加载。
????????④CZML是一种开放数据格式,并且是可拓展的。
????????⑤Github 上维护了一个用于编写 CZML 的开源库 czml-writer。
 ????CZML数据源加载可以通过CZMLDataSource类的load方法直接进行加载,并返回一个promise对象。例如,官网给出的示例代码如下,
  viewer.dataSources.add(
    Cesium.CzmlDataSource.load("https://sandcastle.cesium.com//SampleData/simple.czml")
  );

  viewer.camera.flyHome(0);
KmlDataSource:Kml数据源

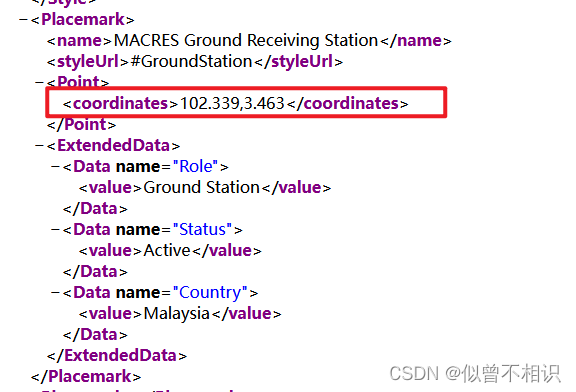
????Kml数据源,全称 Keyhole Markup Language 2.2 (KML),最初是由Google 旗下的Keyhole 公司开发和维护的一种基于XML 的标记语言,利用XML 语法格式描述地理空间数据(如点、线、面、多边形和模型等,包括style样式和coordinates坐标属性),适合网络环境下的地理信息协作与共享。Cesium并不完全支持这种数据源,官网示例代码如下,
 viewer.dataSources.add(
          Cesium.KmlDataSource.load(
            "https://sandcastle.cesium.com/SampleData/kml/facilities/facilities.kml",
            options
          )
);
GeoJsonDataSource:GeoJson数据源
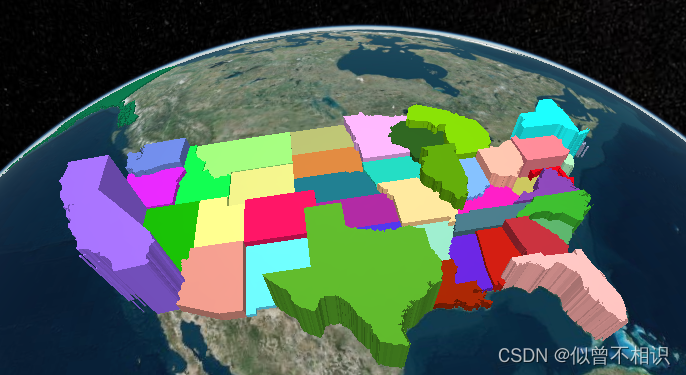
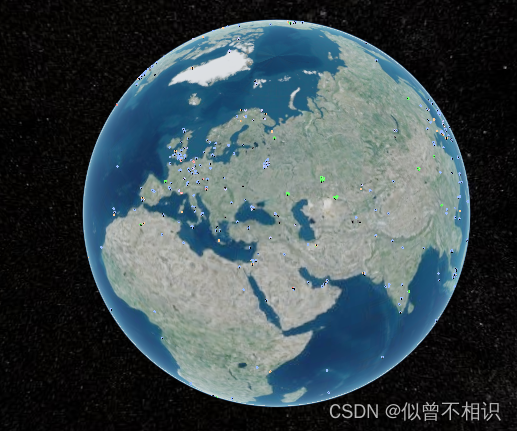
????GeoJson数据源,可用于处理GeoJson和TopoJSON两种数据格式,geojson数据格式样例,可点击此处;TopoJson数据格式样例,可点击此处,两者的均可通过GeoJsonDataSource类的load方法进行加载,并返回一个promise实例,可以通过这个Promise对象进行数据源样式的自定义,如上图所示。
//geojson数据加载
const dataSource = Cesium.GeoJsonDataSource.load(
  "https://sandcastle.cesium.com//SampleData/simplestyles.geojson"
);
viewer.dataSources.add(dataSource);
viewer.zoomTo(dataSource);

//topojson数据加载
const promise = Cesium.GeoJsonDataSource.load(
    "https://sandcastle.cesium.com//SampleData/ne_10m_us_states.topojson"
  );
  promise
    .then(function (dataSource) {
      viewer.dataSources.add(dataSource);

      //Get the array of entities
      const entities = dataSource.entities.values;

      const colorHash = {};
      for (let i = 0; i < entities.length; i++) {
       	//获取加载到的每一个Entity实体
        const entity = entities[i];
        const name = entity.name;
        let color = colorHash[name];
        if (!color) {
        	//产生随机色
          color = Cesium.Color.fromRandom({
            alpha: 1.0,
          });
          colorHash[name] = color;
        }
				//设置填充色
        entity.polygon.material = color;
        //不显示边框
        entity.polygon.outline = false;
        //设置多边形拉伸效果
        entity.polygon.extrudedHeight =
          entity.properties.Population / 50.0;
      }
    })
    .catch(function (error) {
      //Display any errrors encountered while loading.
      window.alert(error);
    });
GeoJsonDataSource数据源:加载全国行政区划边界
????全国行政区划边界,采用阿里DataV中提供的GeoJson API接口获取。下图是要进行加载边界范围。
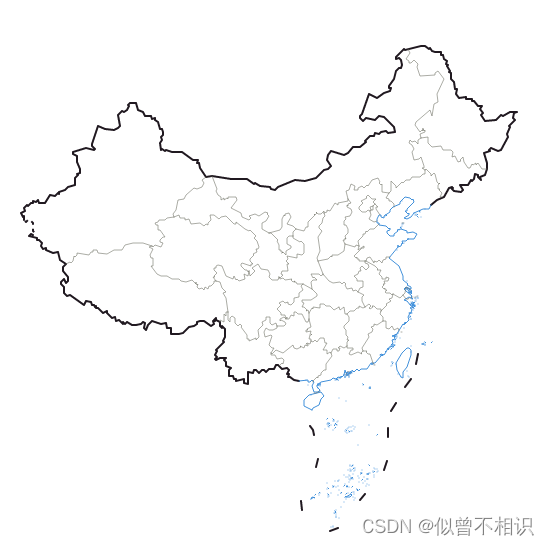
行政区划边界数据
????获取到数据之后,将其保存为本地geojson格式的文件,并将其放入项目文件夹下(如果不想保存的话,也可以通过url直接进行加载)。
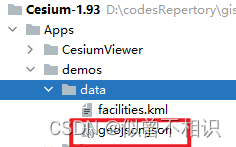
加载geojson数据源
????先贴张效果图,
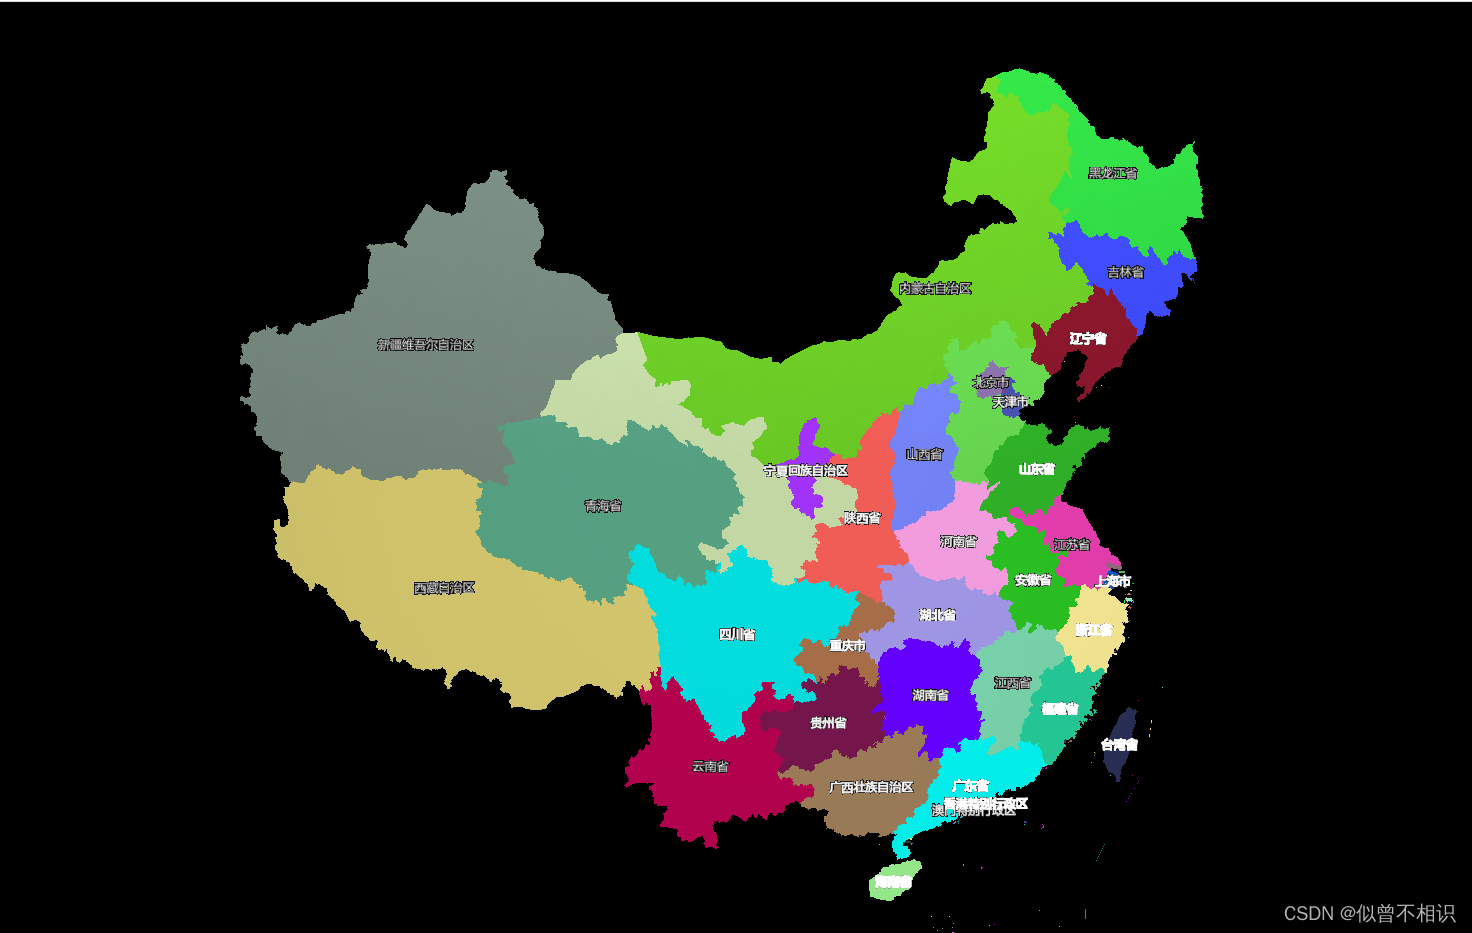 ????示例代码如下,
<!DOCTYPE html>
<html lang="en">
<head>
    <meta charset="UTF-8">
    <title>04-加载行政区划边界</title>
    <!-- 引入Cesium开发包js资源-->
    <script src="../../Build/Cesium/Cesium.js"></script>
    <!-- 引入Cesium开发包css资源-->
    <style>
        @import url("../../Build/Cesium/Widgets/widgets.css");
        html,body,
        #viewerContainer{
            width: 100%;
            height: 100%;
            margin: 0;
            padding: 0;
            overflow: hidden;
        }
    </style>
</head>
<body>
    <div id="viewerContainer"></div>
</body>
<script src="./utils/initCesiumViewer.js"></script>
<script src="./utils/buildEntityUtil.js"></script>
<script>
    const viewer = initCesiumViewer("viewerContainer");
    //移除默认的所有图层
    viewer.imageryLayers.removeAll(true);
    //设置球体透明
    viewer.scene.globe.translucency.enabled = true;
    viewer.scene.globe.baseColor = Cesium.Color.TRANSPARENT;
    viewer.scene.globe.undergroundColor = Cesium.Color.TRANSPARENT;
    //加载geojsonDataSource数据源
    var geojsonData_Promise = Cesium.GeoJsonDataSource.load("./data/geojson.json");
    //挂载properties属性信息
    geojsonData_Promise.then(function (dataSource){
        //加载数据源
        viewer.dataSources.add(dataSource);
        //遍历数据源-为entity设置properties属性信息
        let entites = dataSource.entities.values;
        for (let i = 0; i < entites.length; i++) {
            let entity = entites[i];
            let entityProperty = entity.properties;
            if (entityProperty.hasProperty("centroid")){
                let name = entityProperty.name._value,
                centerPoint = entityProperty.centroid._value;
                // console.log(entityProperty.hasProperty("centroid"))
                //添加文字注记
                let labelEntity =  buildBasicEntityUtil(viewer,"label",{
                    name: name,
                    show: true, // 是否显示
                    position: Cesium.Cartesian3.fromDegrees(centerPoint[0],centerPoint[1],100),
                    labelParams:{
                        text:name,
                        font:"12px sans-serif",
                        backgroundColor:Cesium.Color.TRANSPARENT,
                    },
                    attributes:entityProperty,
                });
                viewer.entities.add(labelEntity);
            }
            // 设置填充颜色
            entity.polygon.material = Cesium.Color.fromRandom({
                alpha: 1.0,
            });
            //不显示边界线
            entity.polygon.outline = false;
        }
    })
    //设置初始视图范围
    viewer.camera.setView({
        destination:new Cesium.Rectangle.fromDegrees(89.5,20.4,110.4,61.2),
    });

</script>
</html>
