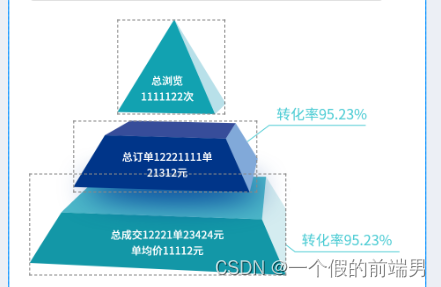
效果图

使用插件echarts 类型pictorialBar:象形柱图
本文只讲述 关键代码
第一步、准备 三张图

第二步、 对data 数据 位置和大小进行微调
需微调的属性symbolSize,symbolOffset 建议使用百分比方便自适应
第三步、对title 数据位置和大小进行微调
需微调的属性title 字段中的top和left
第四步、画折现

代码
<div class="broken-line">11</div>
.broken-line {
	position: relative;
	width: 100px;
	padding-left: 10px;
	margin: 100px;
	font-size: 16px;
	color: #4cccd4;
	border-bottom: 1px solid #4cccd4;
	&::before {
		position: absolute;
		top: -1px;
		left: 0;
		width: 40px;
		height: 100%;
		content: "";
		border-bottom: 1px solid #4cccd4;
		transform: rotate(-220deg);
		transform-origin: left bottom;
	}
}
全部代码 及部分css 代码包裹图表的盒子需相对定位 折线需提升层级 和 绝对定位
<template>
	<div class="box">
		<div ref="echartsRef" class="pie-box"></div>
		<div class="broken-line-box"><div class="broken-line">11</div></div>
		<div class="broken-line-box1"><div class="broken-line">11</div></div>
	</div>
</template>

<script setup lang="ts" name="pieChart">
import { ref, onMounted } from "vue";
import * as echarts from "echarts";
import { useEcharts } from "@/hooks/useEcharts";
const echartsRef = ref<HTMLElement>();

// 定义标题
const title = (text, top, left, color, fontStyle, fontFamily, fontSize) => {
	return {
		text: text,
		top: top,
		left: left,
		textStyle: {
			color: color,
			fontStyle: fontStyle,
			fontFamily: fontFamily,
			fontSize: fontSize
		}
	};
};
onMounted(() => {
	// 项目中封装的hooks 请改成自己的写法
	let myChart: echarts.ECharts = echarts.init(echartsRef.value as HTMLElement);

	let option: echarts.EChartsOption = {
		// 定义标题 需根据效果图 来微调
		title: [
			title("指标一", "28%", "32%", "white", "normal", "sans-serif", "12"),
			title("20", "33%", "34%", "white", "normal", "sans-serif", "12"),
			title("指标二", "56%", "32%", "white", "normal", "sans-serif", "12"),
			title("40", "61%", "34%", "white", "normal", "sans-serif", "12"),
			title("指标三", "80%", "32%", "white", "normal", "sans-serif", "12"),
			title("60", "85%", "34%", "white", "normal", "sans-serif", "12")
		],
		color: ["#bb0004", "#FFD48A"],
		grid: { left: "10%", top: "19%", bottom: "0%" },
		xAxis: {
			show: false,
			data: ["", "", "", ""], // 分成4分 必须有
			axisTick: {
				show: false
			},
			axisLabel: {
				color: "#5EA2ED",
				interval: 0
			},
			axisLine: {
				lineStyle: {
					color: "#1B5BBA"
				}
			}
		},
		yAxis: {
			show: false,
			splitLine: { show: false },
			axisLine: {
				lineStyle: {
					color: "#1B5BBA"
				}
			},
			axisLabel: {
				color: "#5EA2ED",
				interval: 0
			}
		},
		series: [
			{
				type: "pictorialBar",
				legendHoverLink: false,
				label: {
					show: false
				},
				data: [
					{
						name: "指标一",
						z: 100,
						value: 20,
						// symbolSize: [123.21, 107.77],
						symbolSize: ["190%", "140%"], // 图片的大小  建议使用百分比 方便自适应
						symbolPosition: "center",
						// symbolOffset: [72, -195],
						symbolOffset: ["69%", "-156%"], // 图片的相对位置
						// 图片:在图片地址前加入image:// + 网络地址
						symbol:
							"image://https://file.yunsaup.com/9810B0DBB85C4F86831BB3B42B0BE43A/78d0f7c4783be6d10080a8a92ac390ab/homeRightTop.png"
					},
					{
						name: "指标二",
						z: 90,
						value: 40,
						// symbolSize: [209.34, 81.25],
						symbolSize: ["330%", "45%"],
						symbolPosition: "center",
						// symbolOffset: [-20, -50],
						symbolOffset: ["-8%", "-57%"],
						symbol:
							"image://https://file.yunsaup.com/9810B0DBB85C4F86831BB3B42B0BE43A/ebdab150721878804e8f4391979161e5/homeRightM.png"
					},
					{
						name: "指标三",
						z: 80,
						value: 60,
						// symbolSize: [291, 140],
						symbolSize: ["500%", "60%"],
						symbolPosition: "center",
						// symbolOffset: [-100, 50],
						symbolOffset: ["-33%", "27%"],
						symbol:
							"image://https://file.yunsaup.com/9810B0DBB85C4F86831BB3B42B0BE43A/279110ebc9e2686e872238f7c12b8695/homeRightB.png"
					}
				]
			}
		]
	};
	useEcharts(myChart, option);
});
</script>

<style scoped lang="scss">
.box {
	position: relative;
	display: flex;
	flex-direction: column;
	width: 100%;
	height: 100%;
	.pie-box {
		flex: 1;
	}
	.broken-line-box {
	position: absolute;
	top: 55px;
	left: 170px;
	z-index: 3000;
	.broken-line {
		position: relative;
		width: 100px;
		padding-left: 10px;
		margin: 100px;
		font-size: 16px;
		color: #4cccd4;
		border-bottom: 1px solid #4cccd4;
		&::before {
			position: absolute;
			top: -1px;
			left: 0;
			width: 40px;
			height: 100%;
			content: "";
			border-bottom: 1px solid #4cccd4;
			transform: rotate(-220deg);
			transform-origin: left bottom;
		}
	}
}
.broken-line-box1 {
	position: absolute;
	top: 200px;
	left: 200px;
	z-index: 3000;
	.broken-line {
		position: relative;
		width: 100px;
		padding-left: 10px;
		margin: 100px;
		font-size: 16px;
		color: #4cccd4;
		border-bottom: 1px solid #4cccd4;
		&::before {
			position: absolute;
			top: -1px;
			left: 0;
			width: 20px;
			height: 100%;
			content: "";
			border-bottom: 1px solid #4cccd4;
			transform: rotate(-140deg);
			transform-origin: left bottom;
		}
	}
}

</style>