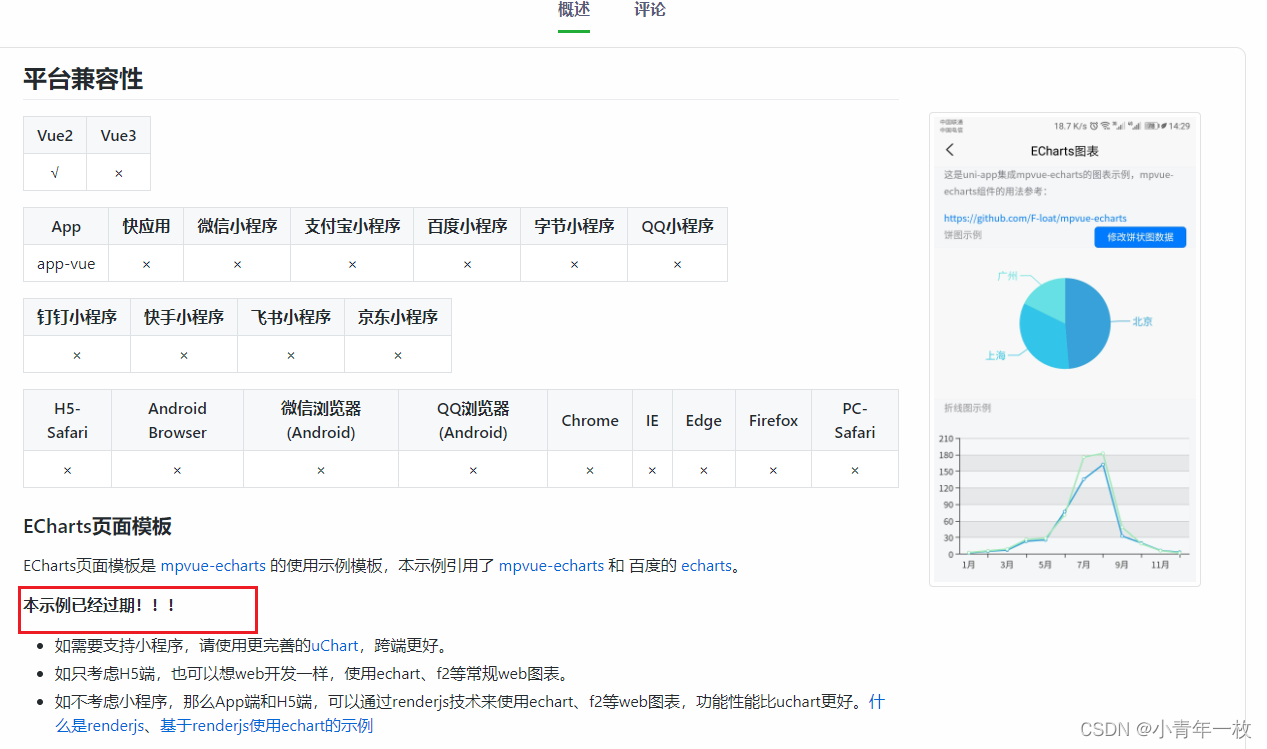
之前使用uniapp来做项目的时候遇到过图表,当时也是使用的echart和uchart,当时echart在uniapp官方插件中说停止维护。

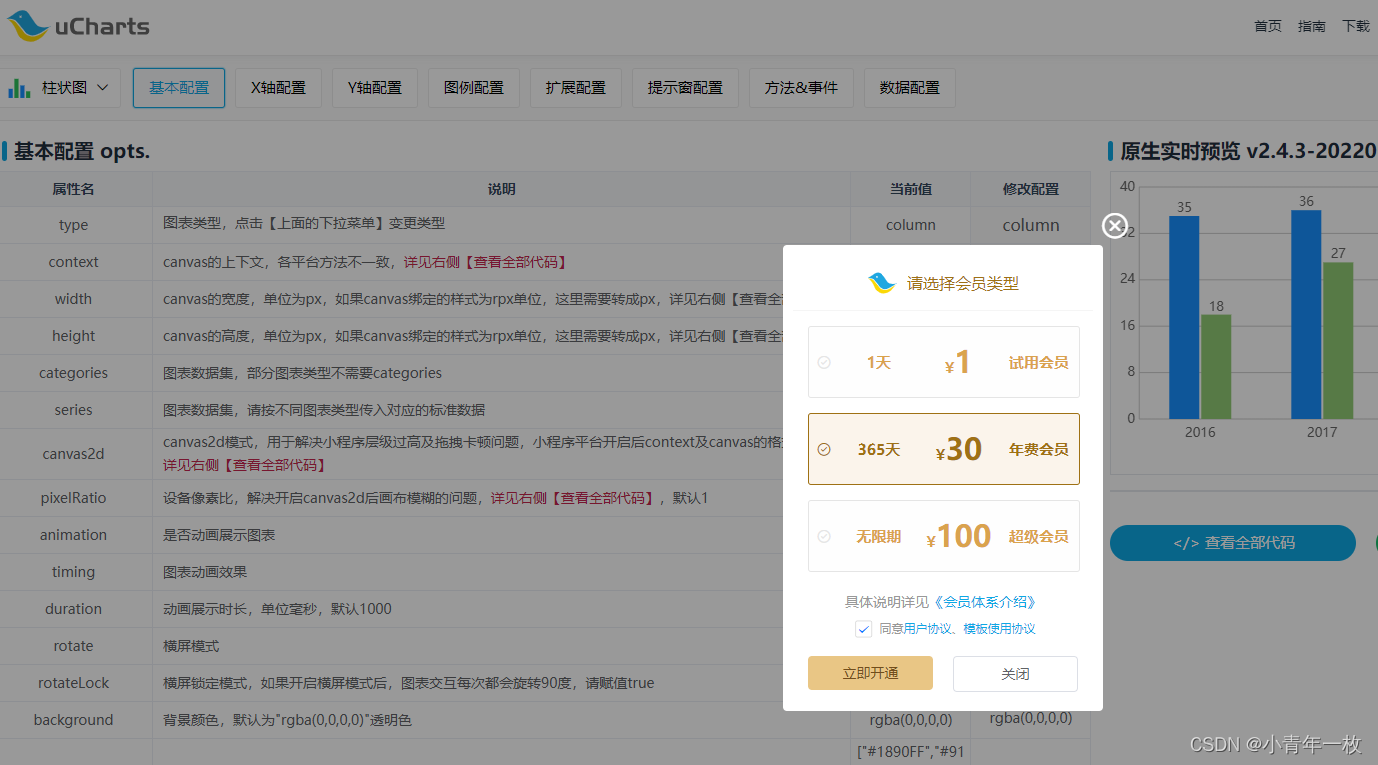
后来就了解到了ucharts,当时使用ucharts还是免费的,现如今ucharts也开始收费了。

因为之前做pc端项目的时候用echarts次数多,使用起来也方便。这次也是采用echarts来实现图表,在开发预览中图表是没问题的,但是在真机运行中发现图表不显示,兼容出问题了。于是乎各种搜索才找到解决的办法。
其实在开发中安装了依赖,但在真机运行的时候还是不行,接下来就演示下操作步骤:
第一步:安装依赖,回车就行
npm install echarts mpvue-echarts --save
第二步:下载echarts.min.js
把下载好的echarts.min.js库放到static文件夹中。
第三步:在components文件夹中新建一个公共组件echarts.vue,
值得注意的是引入echarts库的路径 script.src = ‘./static/echarts.min.js’
<template>
	<view>
		<view class="echarts" :prop="option" :change:prop="echarts.update"></view>
	</view>
</template>

<script>
	export default {
		name: 'Echarts',
		props: {
			option: {
				type: Object,
				required: true
			}
		}
	}
</script>

<script module="echarts" lang="renderjs">
	export default {
		data() {
			return {
				chart: null
			}
		},
		mounted() {
			if (typeof window.echarts === 'object') {
				this.init()
			} else {
				// 动态引入类库
				const script = document.createElement('script')
				script.src = './static/echarts.min.js'
				// script.src = './static/echarts/echarts.min.js'
				script.onload = this.init
				document.head.appendChild(script)
			}
		},
		methods: {
			/**
			 * 初始化echarts
			 */
			init() {
				this.chart = echarts.init(this.$el)
				this.update(this.option)
			},
			/**
			 * 监测数据更新
			 * @param {Object} option
			 */
			update(option) {
				if (this.chart) {
					// 因App端,回调函数无法从renderjs外传递,故在此自定义设置相关回调函数
					if (option) {
						// tooltip
						if (option.tooltip) {
							// 判断是否设置tooltip的位置
							if (option.tooltip.positionStatus) {
								option.tooltip.position = this.tooltipPosition()
							}
							// 判断是否格式化tooltip
							if (option.tooltip.formatterStatus) {
								option.tooltip.formatter = this.tooltipFormatter(option.tooltip.formatterUnit, option.tooltip.formatFloat2, option.tooltip.formatThousands)
							}
						}
                    // 设置新的option
					this.chart.setOption(option, option.notMerge)
					}

				}
			},
			/**
			 * 设置tooltip的位置,防止超出画布
			 */
			tooltipPosition() {
				return (point, params, dom, rect, size) => {
					//其中point为当前鼠标的位置,size中有两个属性:viewSize和contentSize,分别为外层div和tooltip提示框的大小
					let x = point[0]
					let y = point[1]
					let viewWidth = size.viewSize[0]
					let viewHeight = size.viewSize[1]
					let boxWidth = size.contentSize[0]
					let boxHeight = size.contentSize[1]
					let posX = 0 //x坐标位置
					let posY = 0 //y坐标位置
					if (x < boxWidth) { //左边放不开
						posX = 5
					} else { //左边放的下
						posX = x - boxWidth
					}
					if (y < boxHeight) { //上边放不开
						posY = 5
					} else { //上边放得下
						posY = y - boxHeight
					}
					return [posX, posY]
				}
			},
			/**
			 * tooltip格式化
			 * @param {Object} unit 数值后的单位
			 * @param {Object} formatFloat2 是否保留两位小数
			 * @param {Object} formatThousands 是否添加千分位
			 */
			tooltipFormatter(unit, formatFloat2, formatThousands) {
				return params => {
					let result = ''
					unit = unit ? unit : ''
					for (let i in params) {
						if (i == 0) {
							result += params[i].axisValueLabel
						}
						let value = '--'
						if (params[i].data !== null) {
							value = params[i].data
							// 保留两位小数
							if (formatFloat2) {
								value = this.formatFloat2(value)
							}
							// 添加千分位
							if (formatThousands) {
								value = this.formatThousands(value)
							}
						}
						// #ifdef H5
						result += '\n' + params[i].seriesName + ':' + value + ' ' + unit
						// #endif

						// #ifdef APP-PLUS
						result += '<br/>' + params[i].marker + params[i].seriesName + ':' + value + ' ' + unit
						// #endif
					}
					return result
				}
			},
			/**
			 * 保留两位小数
			 * @param {Object} value
			 */
			formatFloat2(value) {
				let temp = Math.round(parseFloat(value) * 100) / 100
				let xsd = temp.toString().split('.')
				if (xsd.length === 1) {
					temp = (isNaN(temp) ? '0' : temp.toString()) + '.00'
					return temp
				}
				if (xsd.length > 1) {
					if (xsd[1].length < 2) {
						temp = temp.toString() + '0'
					}
					return temp
				}
			},
			/**
			 * 添加千分位
			 * @param {Object} value
			 */
			formatThousands(value) {
				if (value === undefined || value === null) {
					value = ''
				}
				if (!isNaN(value)) {
					value = value + ''
				}
				let re = /\d{1,3}(?=(\d{3})+$)/g
				let n1 = value.replace(/^(\d+)((\.\d+)?)$/, function(s, s1, s2) {
					return s1.replace(re, '$&,') + s2
				})
				return n1
			}
		}
	}
</script>

<style lang="scss" scoped>
	.echarts {
		width: 100%;
		height: 100%;
	}
</style>
第四步:在page目录下新建一个页面,也就是需要引入图表的页面。
<template>
	<view class="echarts">
		<echarts :option="option" style="height: 620rpx;"></echarts>
	</view>
</template>
<script>
	import echarts from '@/components/echarts/echarts.vue';
	export default {
		data() {
			return {
				option: {},
			};
		},
		components: {
			echarts
		},
		mounted() {
			this.logstatrt();
		},
		methods: {
			logstatrt() {
				console.log('初次调用');
				this.option = {

					series: [{
						radius: '100%',
						type: 'gauge',
						startAngle: 180,
						endAngle: 0,
						min: 0,
						max: 1,
						splitNumber: 0,
						pointer: {
							show: false
						},
						axisLine: {
							lineStyle: {
								width: 45,
								color: [
									[0.8, '#005CFF'],
									[1, '#00CEF3']
								]
							}
						},
						splitLine: {
							length: 0
						},
						axisLabel: {
							color: '#464646',
							fontSize: 20,
							distance: -60,
							formatter: function(value) {
								return '';
							}
						},
						title: {
							offsetCenter: [0, '-20%'],
							fontSize: 20,
							color: '#fff'
						},
						detail: {
							fontSize: 30,
							offsetCenter: [0, '-40%'],
							valueAnimation: true,
							formatter: function(value) {
								return value;
							},
							color: '#fff'
						},
						data: [{
							name: ' 总数',
							value: 10000
						}]
					}]
				};
			},
		}
	</script>
这样就完美解决掉echarts在真机中兼容问题了。
还在加班中,写个笔记记录下,继续搬砖了。。。