观摩一下开源项目vue-element-admin的源码,来看看花裤衩大神是如何优雅的写代码,如何封装业务组件的,顺便如果能在自己的项目中应用想必也是极好的

首先拉取代码然后在本地运行
下载依赖的时候遇到报错
echarts
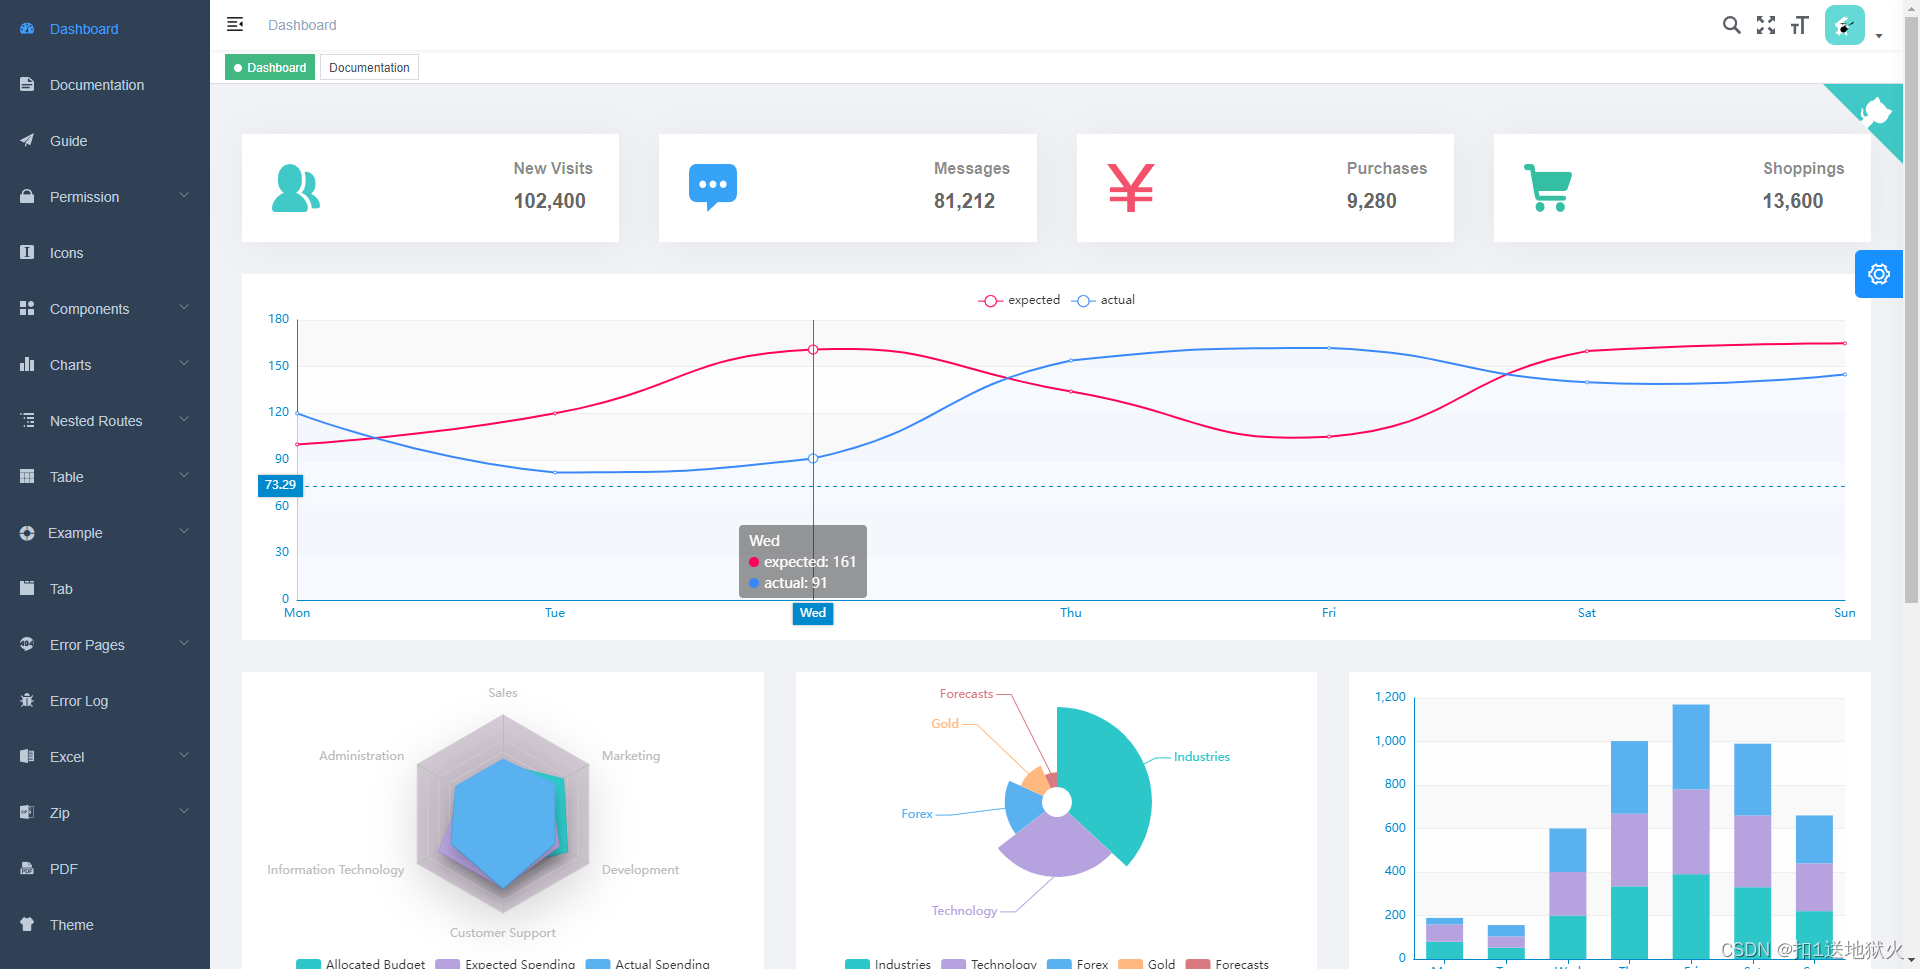
代码运行后第一眼就看见我前些天研究的图表,刚好项目是用的echarts,趁着还有些印象,先来研究一下Vue-element-admin是如何在项目中使用echarts的
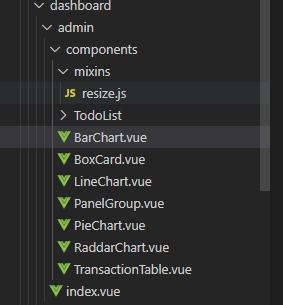
?看了几个图表后就得折线图比较符合我的思路就以折线图为例
src/views/dashboard/admin/components/LineChart.vue
先把代码复制下来逐行分析
<template>
  <div
    :class="className"
    :style="{height:height,width:width}"
  />
</template>

<script>
//导入echarts 好像不是按需导入
import echarts from 'echarts'
require('echarts/theme/macarons') // echarts theme
import resize from './mixins/resize' //应该是封装的resize函数等下再看

export default {
  mixins: [resize],//通过混合使用
  props: {
    //图表样式
    className: {
      type: String,
      default: 'chart'
    },
    width: {
      type: String,
      default: '100%'
    },
    height: {
      type: String,
      default: '350px'
    },
    //不知道啥用 false 和true好像没区别
    autoResize: {
      type: Boolean,
      default: true
    },
    //接收图表数据
    chartData: {
      type: Object,
      required: true
    }
  },
  data () {
    return {
      chart: null
    }
  },
  //监听数据变化 如果发生改变就重新渲染图表
  watch: {
    chartData: {
      deep: true,
      handler (val) {
        this.setOptions(val)
      }
    }
  },
  //创建图表
  mounted () {
    this.$nextTick(() => {
      this.initChart()
    })
  },
  // 销毁图表实例
  beforeDestroy () {
    if (!this.chart) {
      return
    }
    this.chart.dispose()
    this.chart = null
  },
  methods: {
    // 初始化图表实例
    initChart () {
      //vm.$el获取Vue实例关联的DOM元素;
      this.chart = echarts.init(this.$el, 'macarons')
      this.setOptions(this.chartData)
    },
    // 接收图表数据进行渲染
    setOptions ({ expectedData, actualData } = {}) {
      this.chart.setOption({
        xAxis: {
          data: ['Mon', 'Tue', 'Wed', 'Thu', 'Fri', 'Sat', 'Sun'],
          boundaryGap: false,
          axisTick: {
            show: false
          }
        },
        grid: {
          left: 10,
          right: 10,
          bottom: 20,
          top: 30,
          containLabel: true
        },
        tooltip: {
          trigger: 'axis',
          axisPointer: {
            type: 'cross'
          },
          padding: [5, 10]
        },
        yAxis: {
          axisTick: {
            show: false
          }
        },
        legend: {
          data: ['expected', 'actual']
        },
        series: [{
          name: 'expected', itemStyle: {
            normal: {
              color: '#FF005A',
              lineStyle: {
                color: '#FF005A',
                width: 2
              }
            }
          },
          smooth: true,
          type: 'line',
          data: expectedData,
          animationDuration: 2800,
          animationEasing: 'cubicInOut'
        },
        {
          name: 'actual',
          smooth: true,
          type: 'line',
          itemStyle: {
            normal: {
              color: '#3888fa',
              lineStyle: {
                color: '#3888fa',
                width: 2
              },
              areaStyle: {
                color: '#f3f8ff'
              }
            }
          },
          data: actualData,
          animationDuration: 2800,
          animationEasing: 'quadraticOut'
        }]
      })
    }
  }
}
</script>
一路看下来没什么问题,只有?autoResize不知道是干什么的,看结构应该是在index.vue传入图表数据
index.vue
没有传入宽高,用的默认值
    <el-row style="background:#fff;padding:16px 16px 0;margin-bottom:32px;">
      <line-chart :chart-data="lineChartData" />
    </el-row>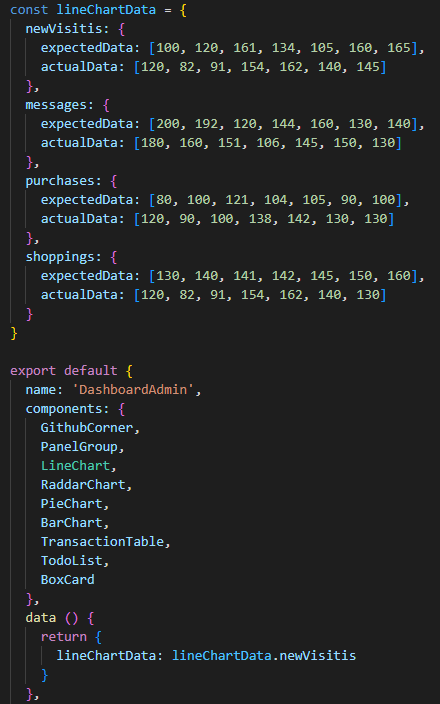
再看看resize.js,我水平不够还没有使用过mixins,正好借这个机会看看怎么使用
import { debounce } from '@/utils'//引入防抖函数等会来看

export default {
  data () {
    return {
      $_sidebarElm: null,//字面意思是侧边栏,没太搞懂什么作用
      $_resizeHandler: null
    }
  },
  mounted () {
    //定义resize事件 echart如果存在就会调用resize 让图表自适应显示
    this.$_resizeHandler = debounce(() => {
      if (this.chart) {
        this.chart.resize()
      }
    }, 100)

    // 窗口大小变化时就会resize保证图表显示正常
    this.$_initResizeEvent()

    //等会再研究
    this.$_initSidebarResizeEvent()
  },
  //销毁上面两个函数
  beforeDestroy () {
    this.$_destroyResizeEvent()
    this.$_destroySidebarResizeEvent()
  },
  //从其他组件切换到当前组件的时候,调用resize事件
  activated () {
    this.$_initResizeEvent()
    this.$_initSidebarResizeEvent()
  },
  //切换到其他组件销毁上面两个方法
  deactivated () {
    this.$_destroyResizeEvent()
    this.$_destroySidebarResizeEvent()
  },
  methods: {
    $_initResizeEvent () {
      window.addEventListener('resize', this.$_resizeHandler)
    },
    $_destroyResizeEvent () {
      window.removeEventListener('resize', this.$_resizeHandler)
    },
    $_sidebarResizeHandler (e) {
      if (e.propertyName === 'width') {//e.propertyName忘了是啥玩意,大概率是改变的属性啥的 等会查查
        this.$_resizeHandler()
      }
    },
    $_initSidebarResizeEvent () {
      this.$_sidebarElm = document.getElementsByClassName('sidebar-container')[0]
      //动画transition结束后调用this.$_sidebarResizeHandler
      this.$_sidebarElm && this.$_sidebarElm.addEventListener('transitionend', this.$_sidebarResizeHandler)
    },
    $_destroySidebarResizeEvent () {
      this.$_sidebarElm && this.$_sidebarElm.removeEventListener('transitionend', this.$_sidebarResizeHandler)
    }
  }
}
图表相关的都能看懂,就是sidebar相关的有点懵,e.propertyName也忘了,查了一下mdn好像有了点思路
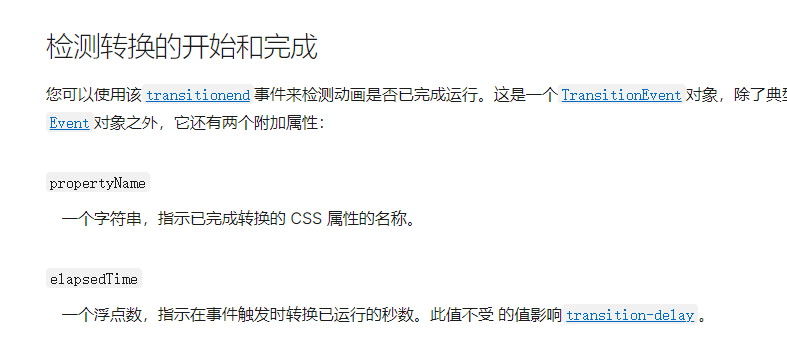
? 我猜测应该是侧边栏宽带发生变化时调用resize方法让图表正常显示
我这里操作了一下侧边栏可以变大变小,当宽带小到一定的时候侧边栏会消失
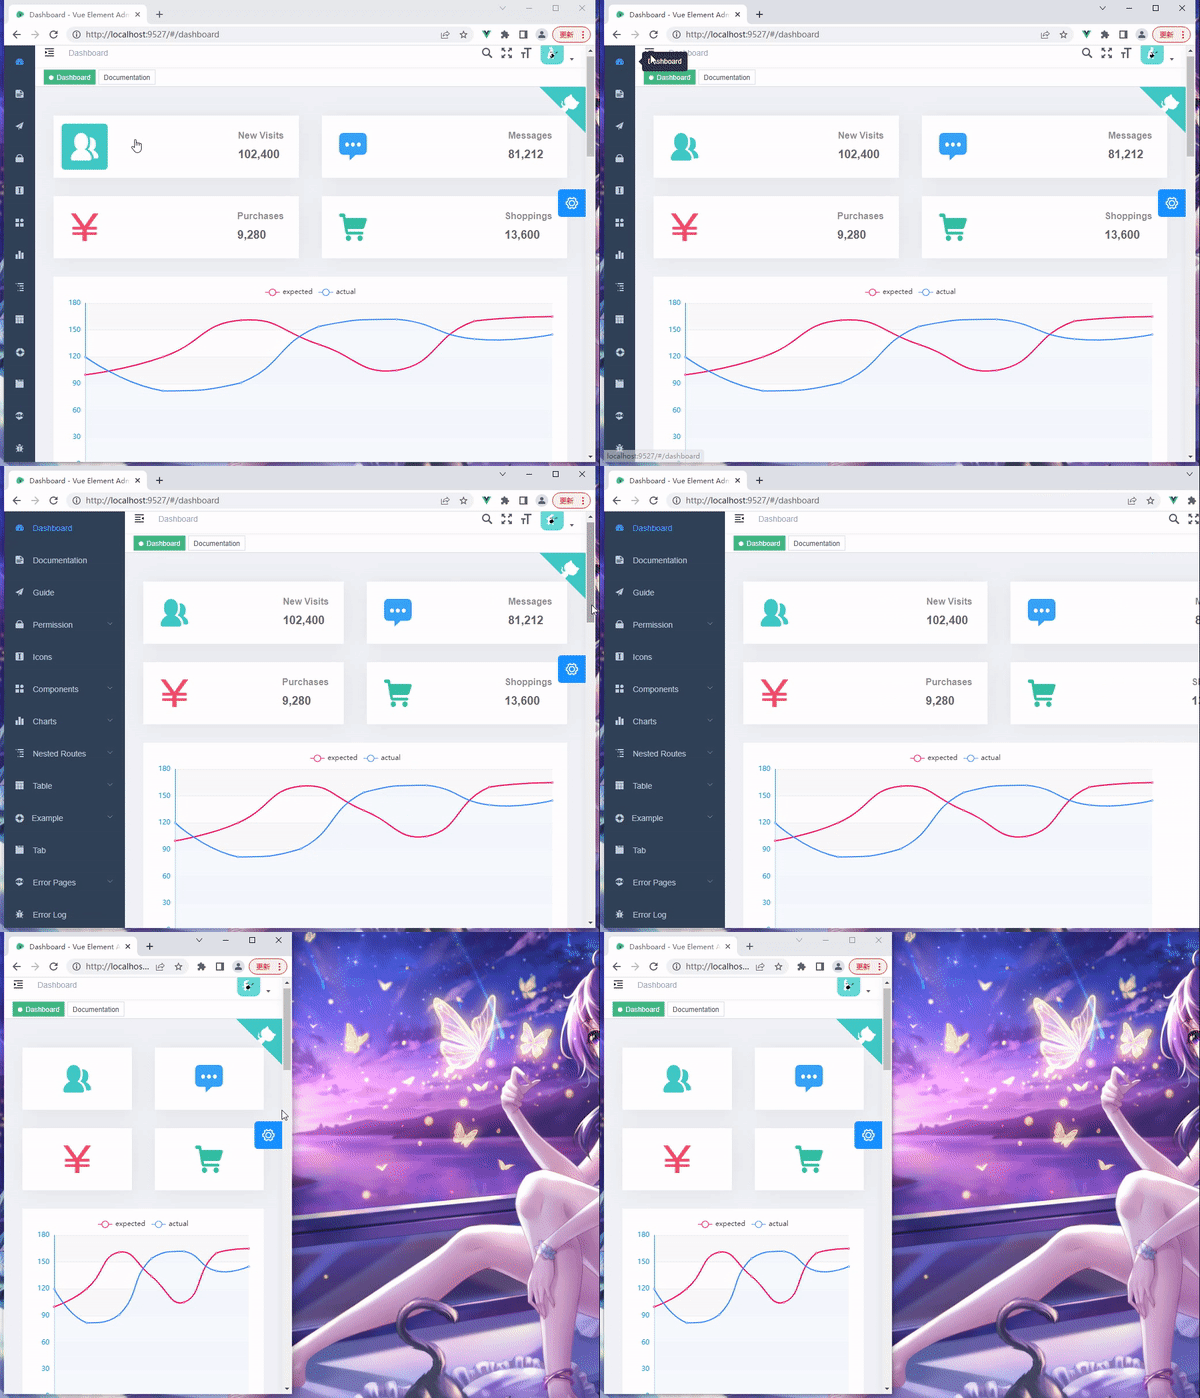
相关代码
    $_sidebarResizeHandler (e) {
      if (e.propertyName === 'width') {
        this.$_resizeHandler()
      }

        $_initSidebarResizeEvent () {
      this.$_sidebarElm = document.getElementsByClassName('sidebar-container')[0]
      //动画transition结束后调用this.$_sidebarResizeHandler
      this.$_sidebarElm && this.$_sidebarElm.addEventListener('transitionend', this.$_sidebarResizeHandler)
    },
最后我在
src/style/sidebar.css中证实了想法
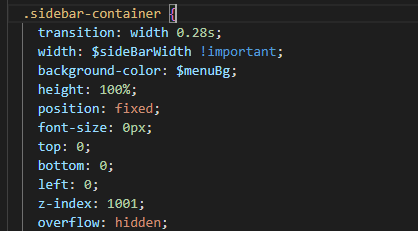
这样一来上面的代码就不难理解了?
通过e.propertyName指示完成动画的css属性名称,然后监听侧边栏的变化,如果是宽带发生改变,就对图表进行resize 保证正常显示
图表部分差不多就这些,用mixin 来处理 resize 代码确实是十分优雅,学到了
直接借鉴到自己的组件中
防抖函数
再分析一下防抖函数
好像和昨天刚看的underscore中防抖函数差不多的思想,有空我写一篇文章仔细分析一下
传入一个参数immediate,代表是否想要立即执行,如果传递了immediate,则立即执行一次函数,然后设置一个定时器,时间截止后将定时器设置为null,下次进入函数时先判断定时器是否为null,然后决定是否再次执行。
/**
 * @param {Function} func
 * @param {number} wait
 * @param {boolean} immediate
 * @return {*}
 */
export function debounce(func, wait, immediate) {
  let timeout, args, context, timestamp, result

  const later = function() {
    // 据上一次触发时间间隔
    const last = +new Date() - timestamp

    // 上次被包装函数被调用时间间隔 last 小于设定时间间隔 wait
    if (last < wait && last > 0) {
      timeout = setTimeout(later, wait - last)
    } else {
      timeout = null
      // 如果设定为immediate===true,因为开始边界已经调用过了此处无需调用
      if (!immediate) {
        result = func.apply(context, args)
        if (!timeout) context = args = null
      }
    }
  }

  return function(...args) {
    context = this
    timestamp = +new Date()
    const callNow = immediate && !timeout
    // 如果延时不存在,重新设定延时
    if (!timeout) timeout = setTimeout(later, wait)
    if (callNow) {
    // 如果定时器不存在并且传递了immediate,立即执行
      result = func.apply(context, args)
      context = args = null
    }

    return result
  }
}
未完待续