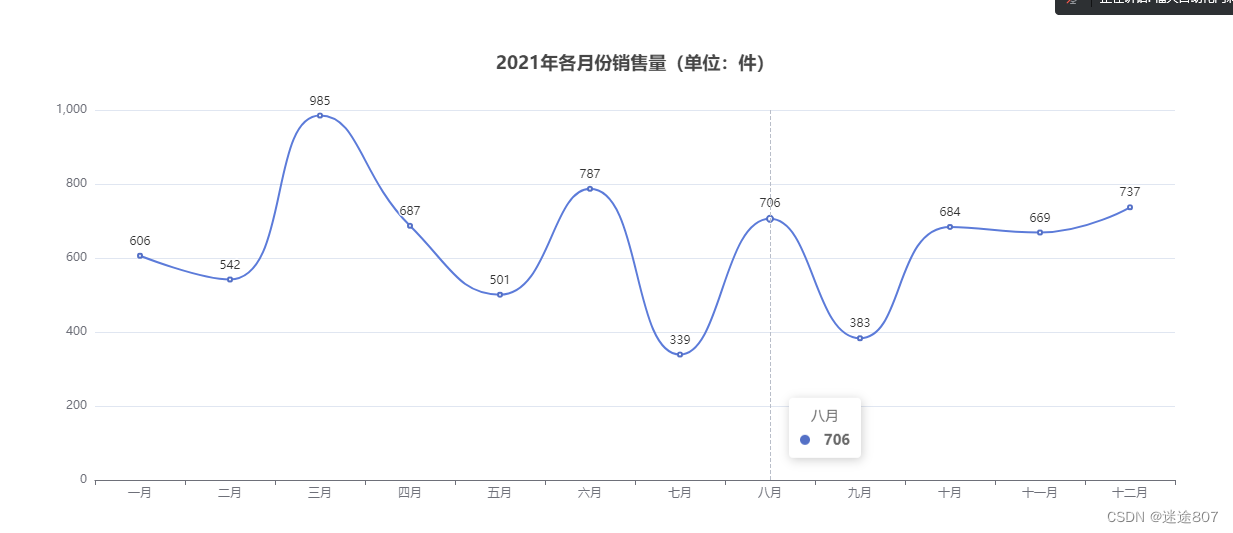
首先就是安装echart依赖:
npm install echarts --save
在main.js中引入echart:
import { createApp } from 'vue'
import App from './App.vue'
import * as echarts from 'echarts'

const app = createApp(App).mount('#app')
app.echarts=echarts
创建一个EChartsView.vue文件:
先创建一个文件,然后粘贴以下代码:
<template>
    <div class="echarts-box">
        <div id="myEcharts" :style="{ width: this.width, height: this.height }"></div>
    </div>
</template>

<script>
    import * as echarts from "echarts";
    import {onMounted, onUnmounted} from "vue";

    export default {
        props: {
            width: {
                type: String,
                default: '100%'
            },
            height: {
                type: String,
                default: '500px'
            }
        },
        setup() {
            let myEcharts = echarts;

            onMounted(() => {
                initChart();
            });

            onUnmounted(() => {
                myEcharts.dispose;
            });

            function initChart() {
                let chart = myEcharts.init(document.getElementById("myEcharts"), "purple-passion");
                chart.setOption({
                    title: {
                        text: "2021年各月份销售量(单位:件)",
                        left: "center",
                    },
                    xAxis: {
                        type: "category",
                        data: [
                            "一月", "二月", "三月", "四月", "五月", "六月", "七月", "八月", "九月", "十月", "十一月", "十二月"
                        ]
                    },
                    tooltip: {
                        trigger: "axis"
                    },
                    yAxis: {
                        type: "value"
                    },
                    series: [
                        {
                            data: [606, 542, 985, 687, 501, 787, 339, 706, 383, 684, 669, 737],
                            type: "line",
                            smooth: true,
                            itemStyle: {
                                normal: {
                                    label: {
                                        show: true,
                                        position: "top",
                                        formatter: "{c}"
                                    }
                                }
                            }
                        }
                    ]
                });
                window.onresize = function () {
                    chart.resize();
                };
            }

            return {
                initChart
            };
        }
    };
</script>
在主页面中引入echart组件:
<template>
  <div class="hello">
    <echart ></echart>
  </div>
</template>

<script>
  import echart from "./EChartsView"
export default {
  name: 'HelloWorld',
  components: {
    echart
  },
  props: {
    msg: String
  },

}
</script>
效果如图:
