![]() ?回顾? 前期??
?回顾? 前期?? ????????
目录

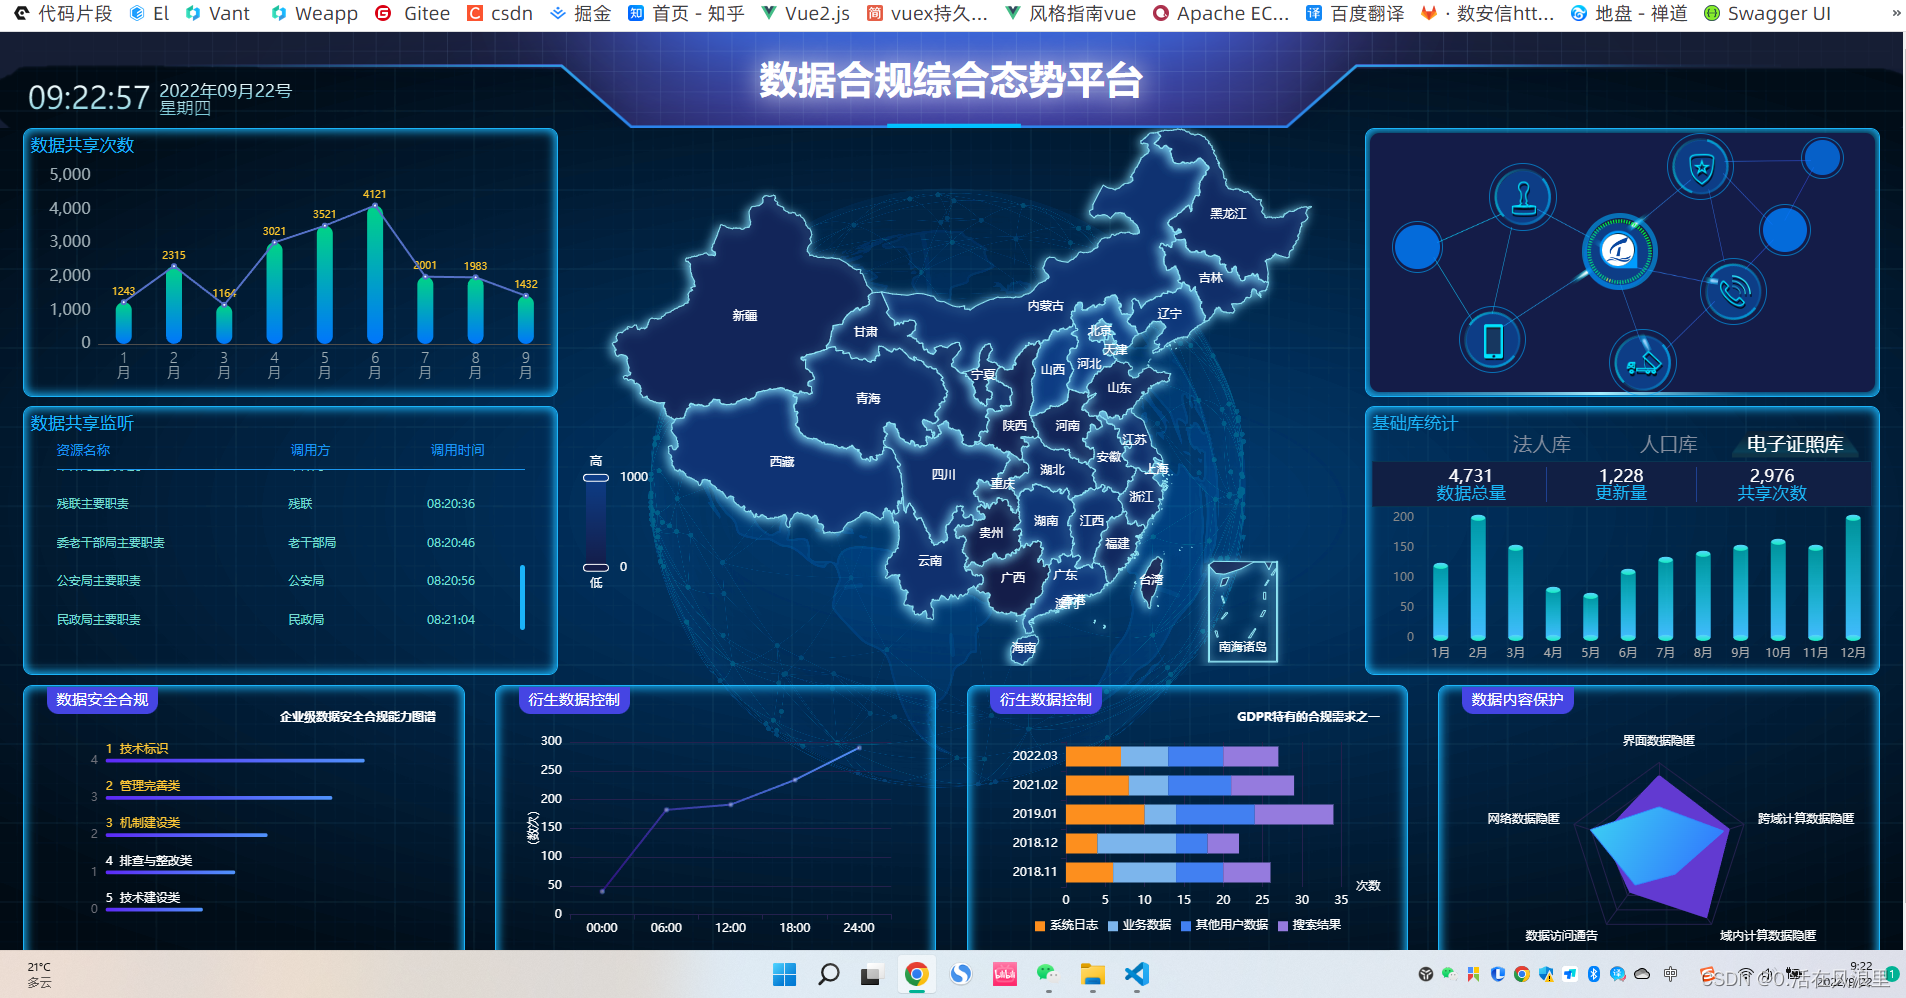
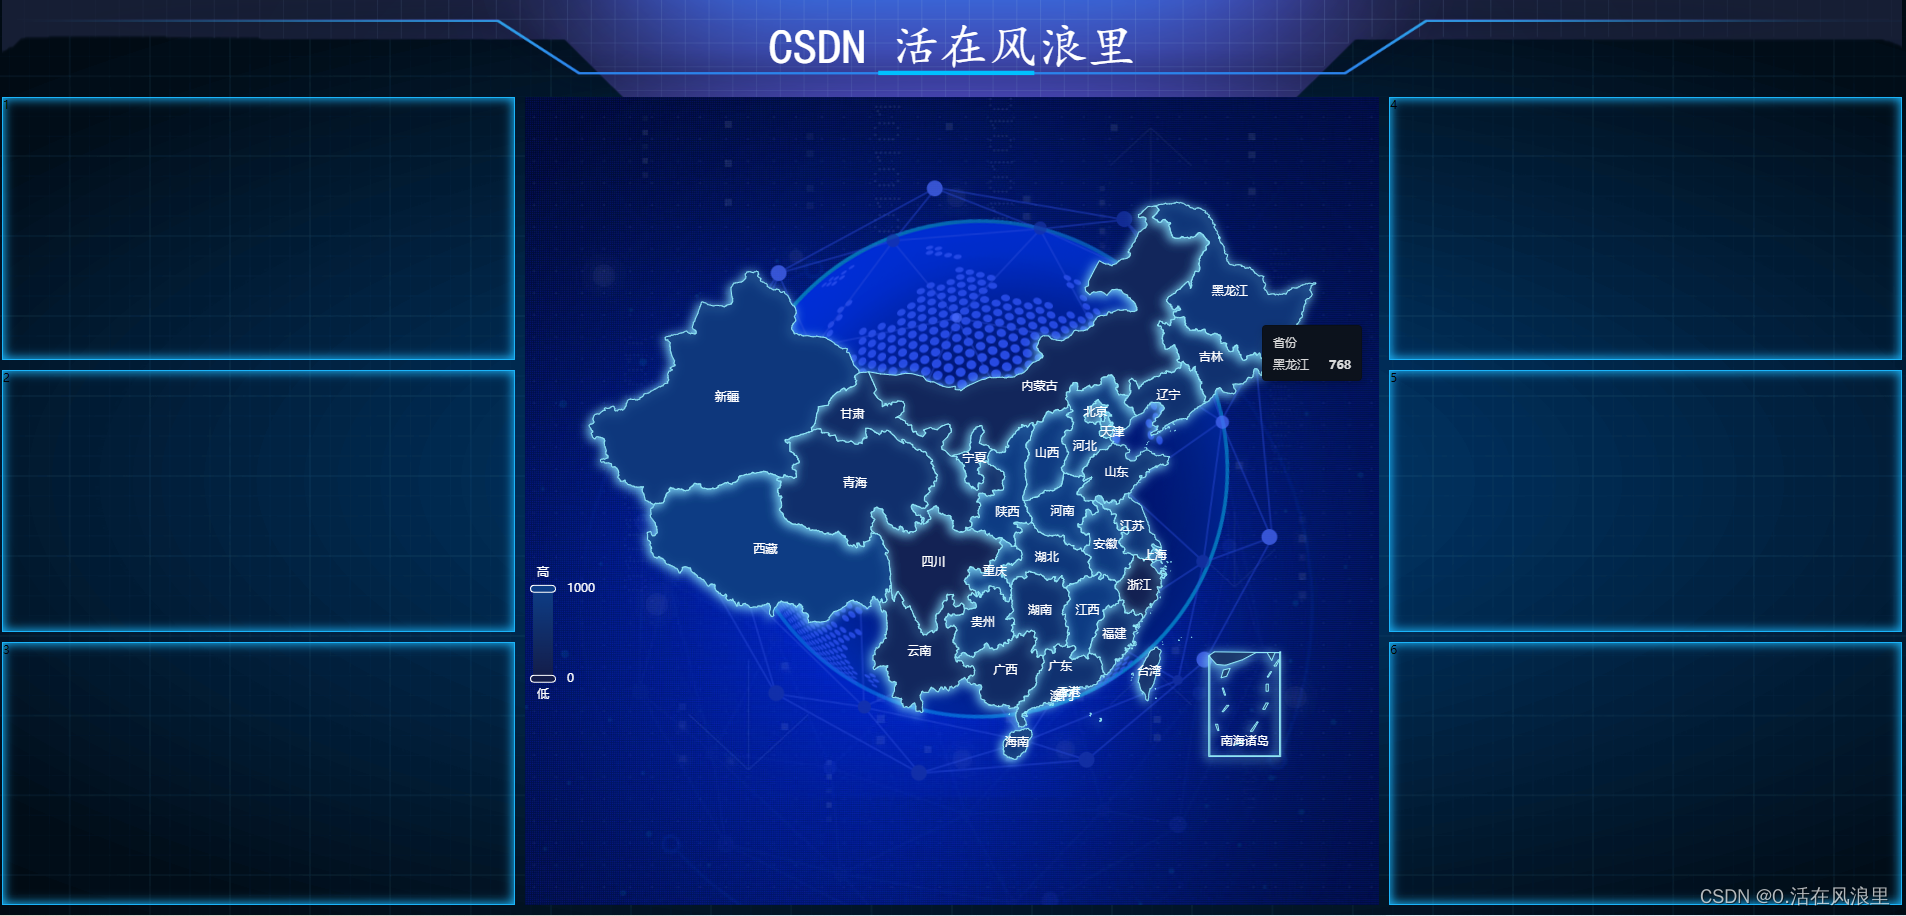
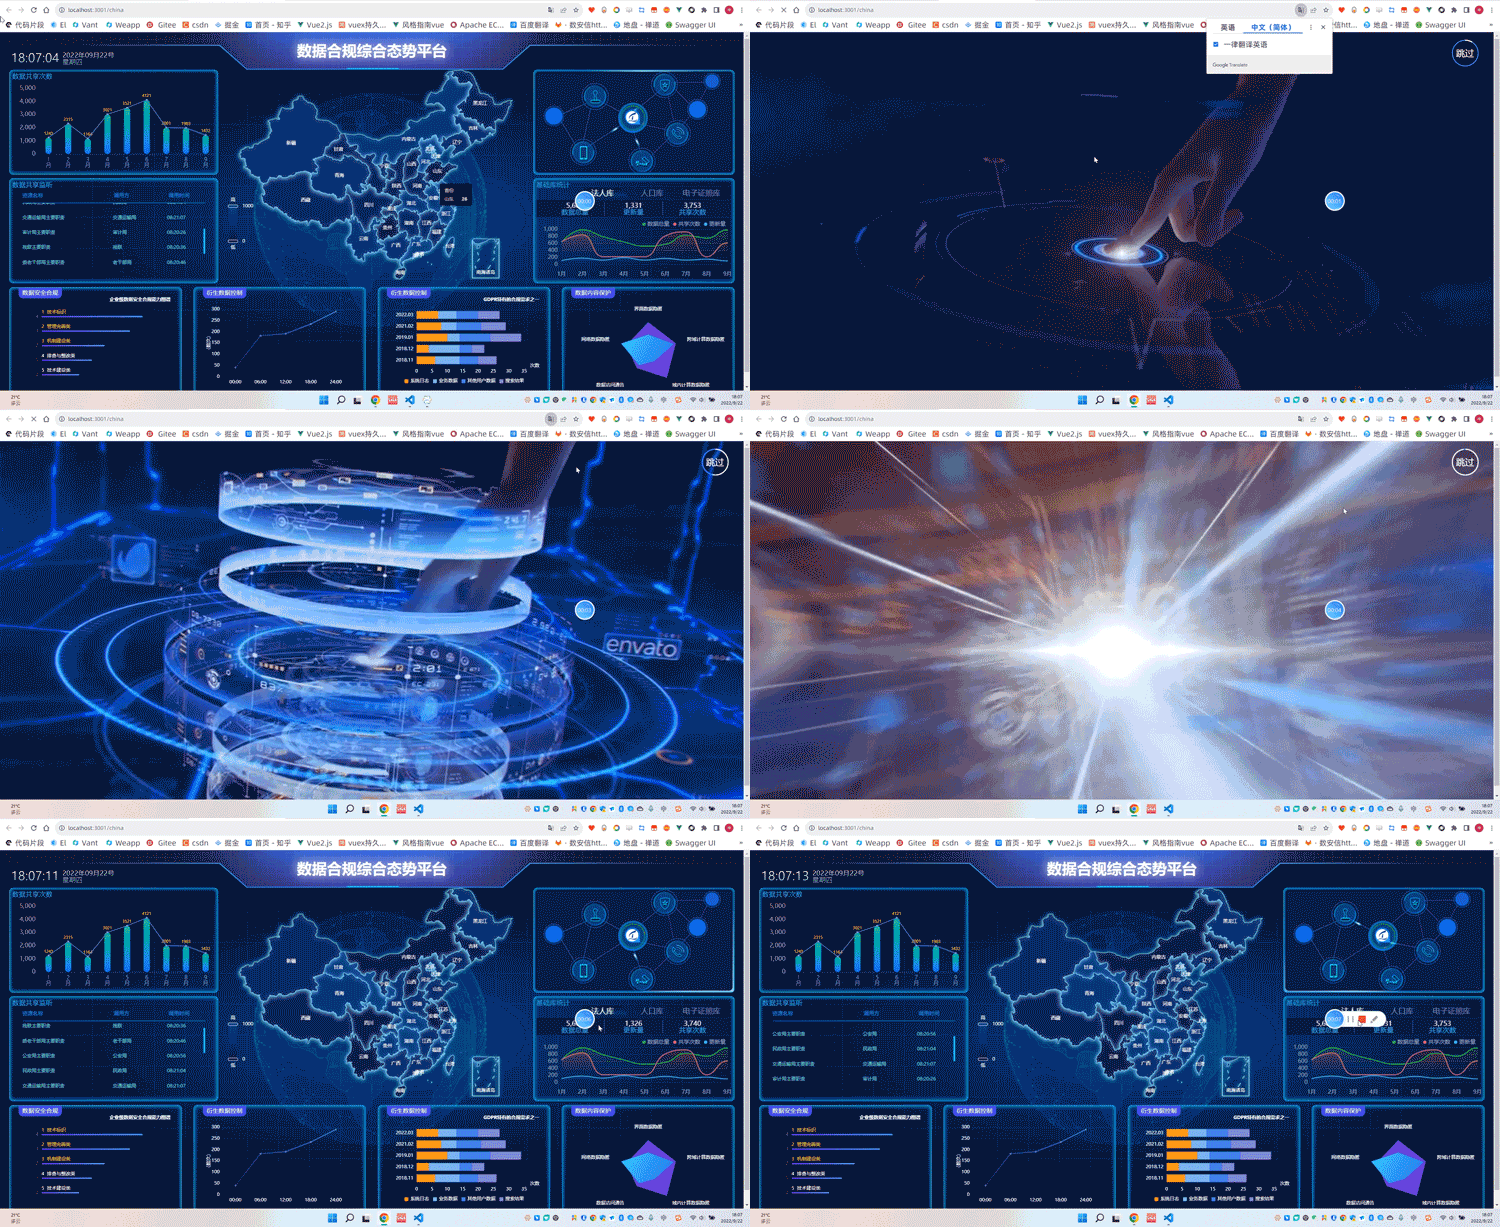
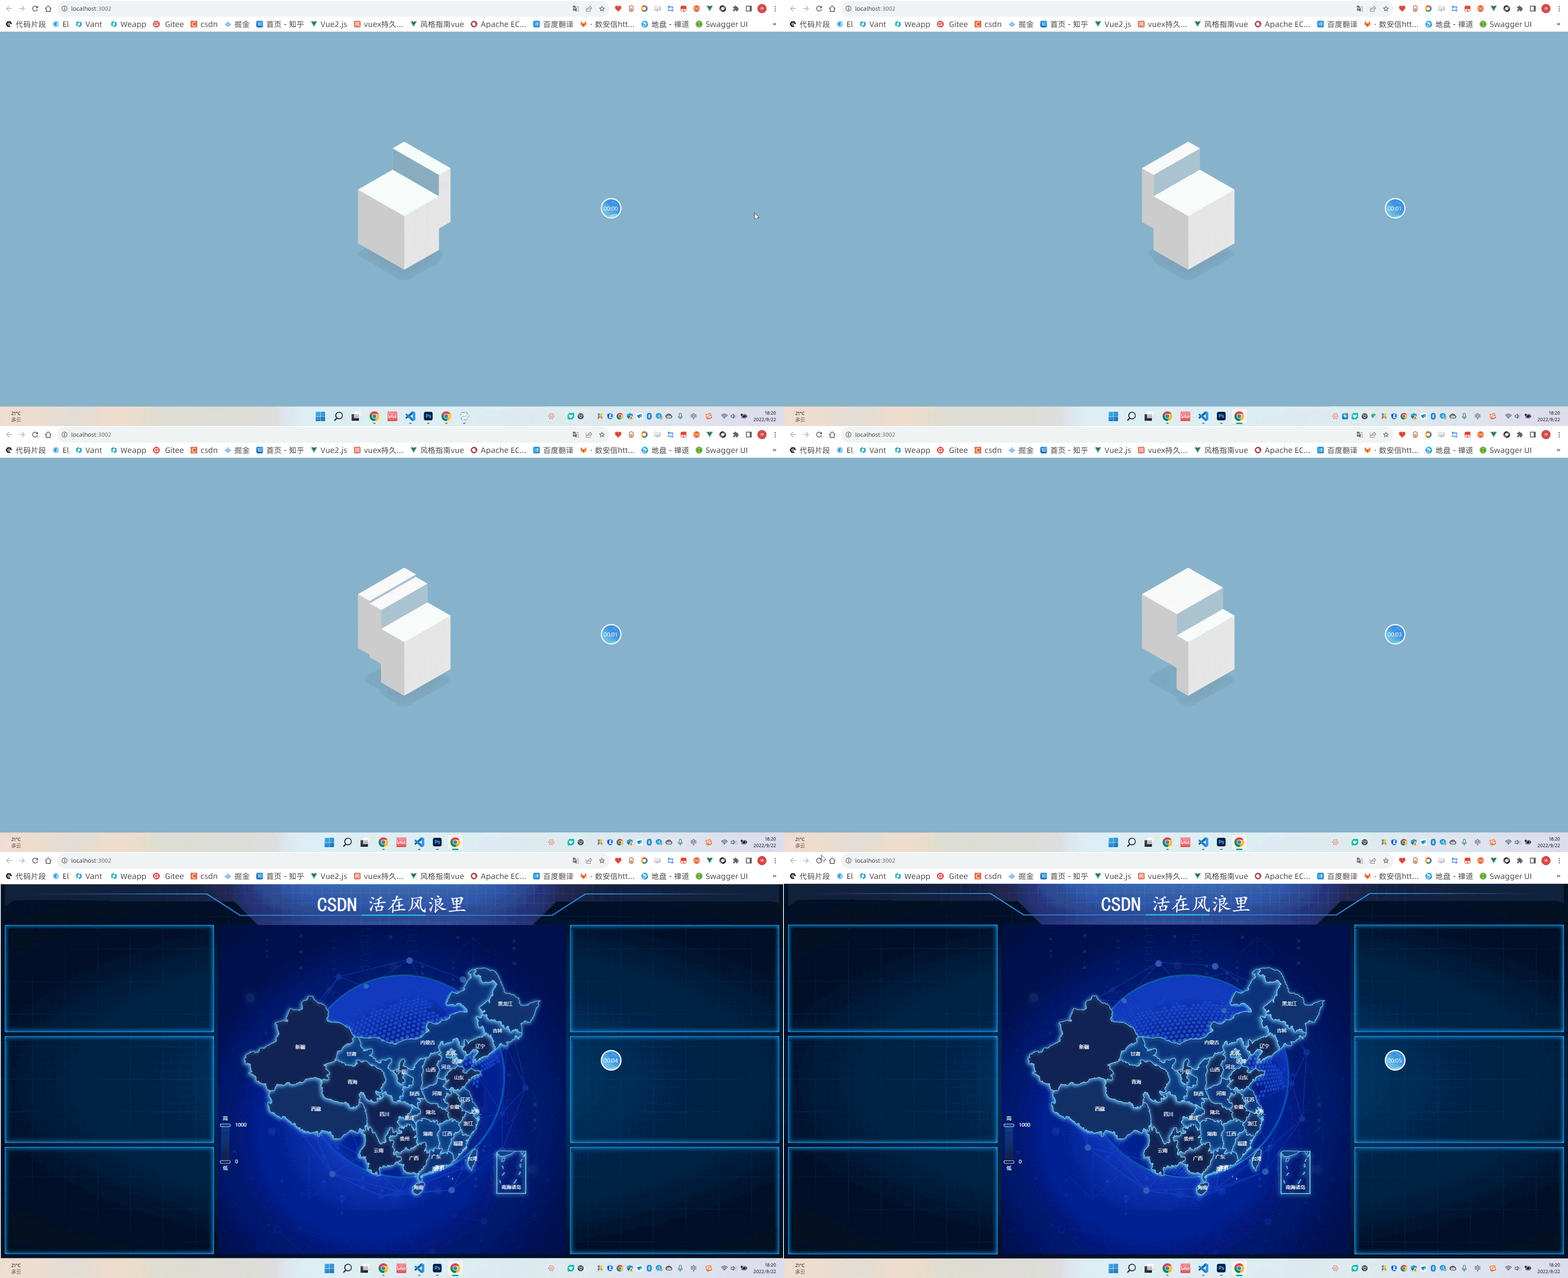
?
项目开始时:?
?首先大屏需要自适应!要设置最大最小宽高!最大最小宽高要是用px单位!其他所有使用rem单位!
念及此!项目开始
如何选择rem设配项目 (六步骤)
这里分享一种轻量极简的方式?
一:安装
cnpm i -S lib-flexible二:根据设计稿修改配置?
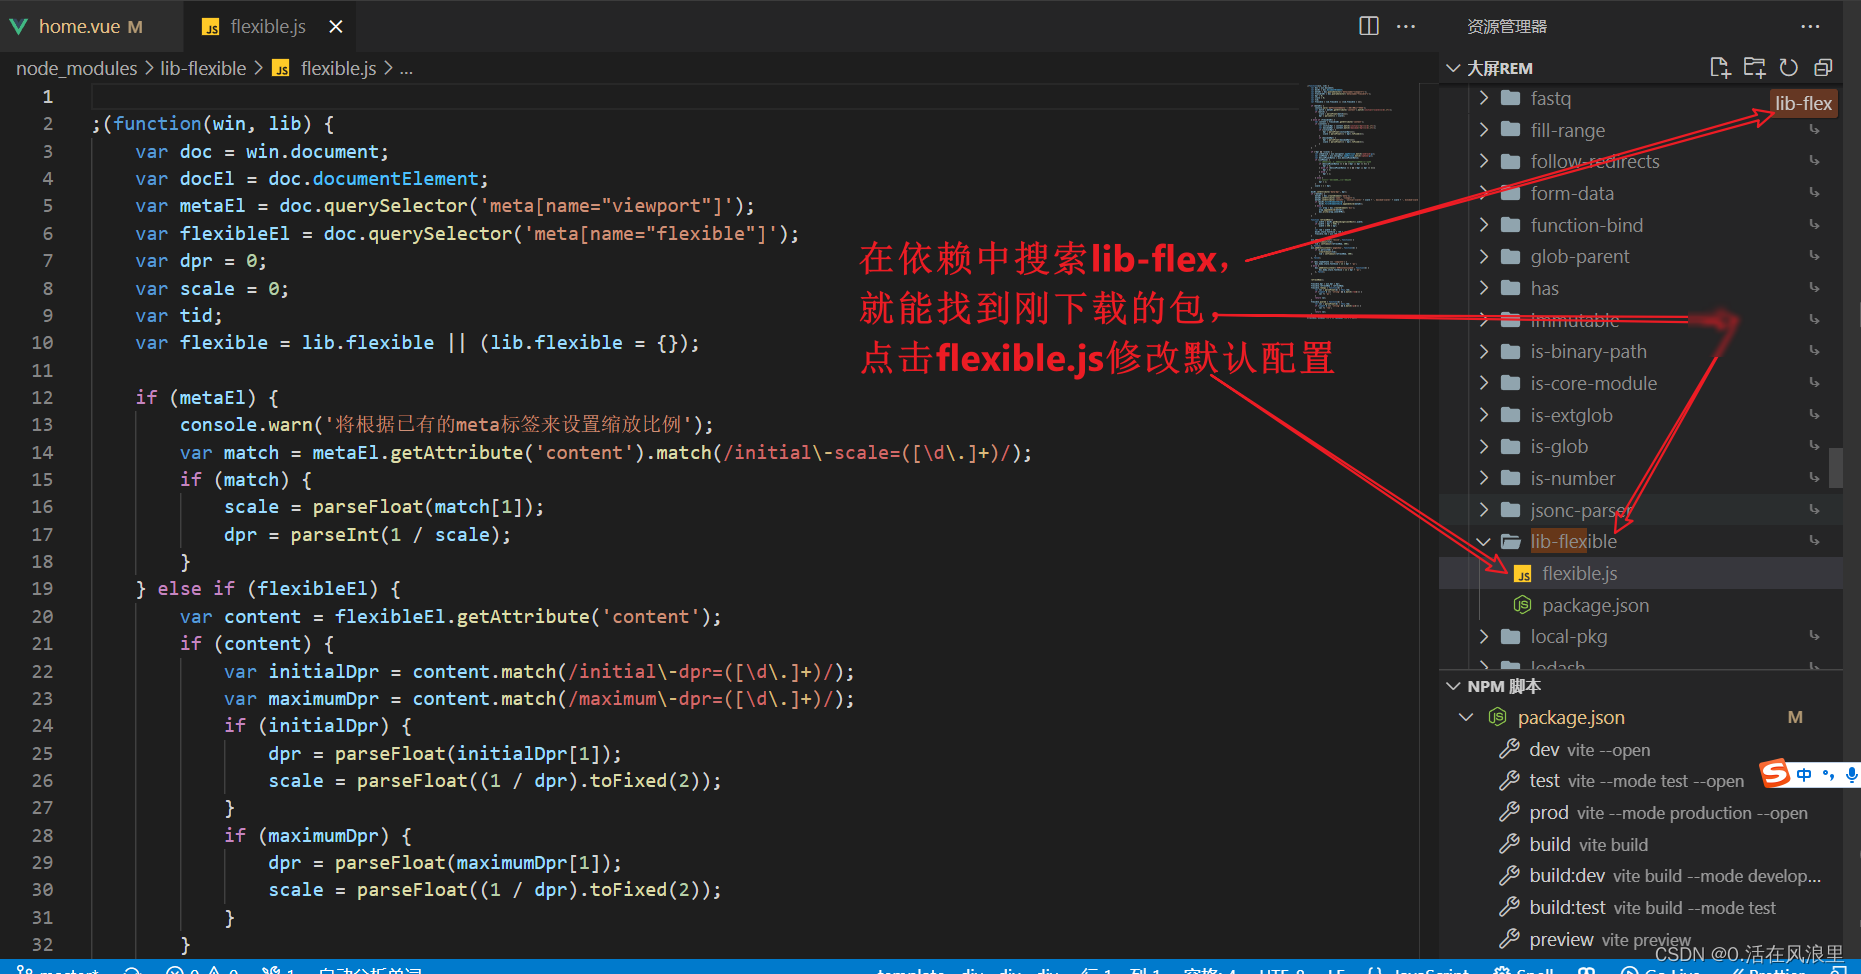
?因为默认情况下只会在540px分辨率一下生效 所以我们需要根据我们的项目分辨率进行调整
在node_module/lib-flexible/flexible.js中修改代码如下
        // 修改原始的
        // if (width / dpr > 540) {
        //     width = 540 * dpr;
        // }
        // var rem = width / 10;
--------------------------------------------------
        // 修改成为
          // 最小400px,最大适配2560px
        if (width / dpr < 400) {
            width = 400 * dpr;
        } else if (width / dpr > 2560) {
            width = 2560 * dpr;
        }
        // 设置成24等份,设计稿时1920px的,这样1rem就是80px (1920/24=80)方便使用
        var rem = width / 24;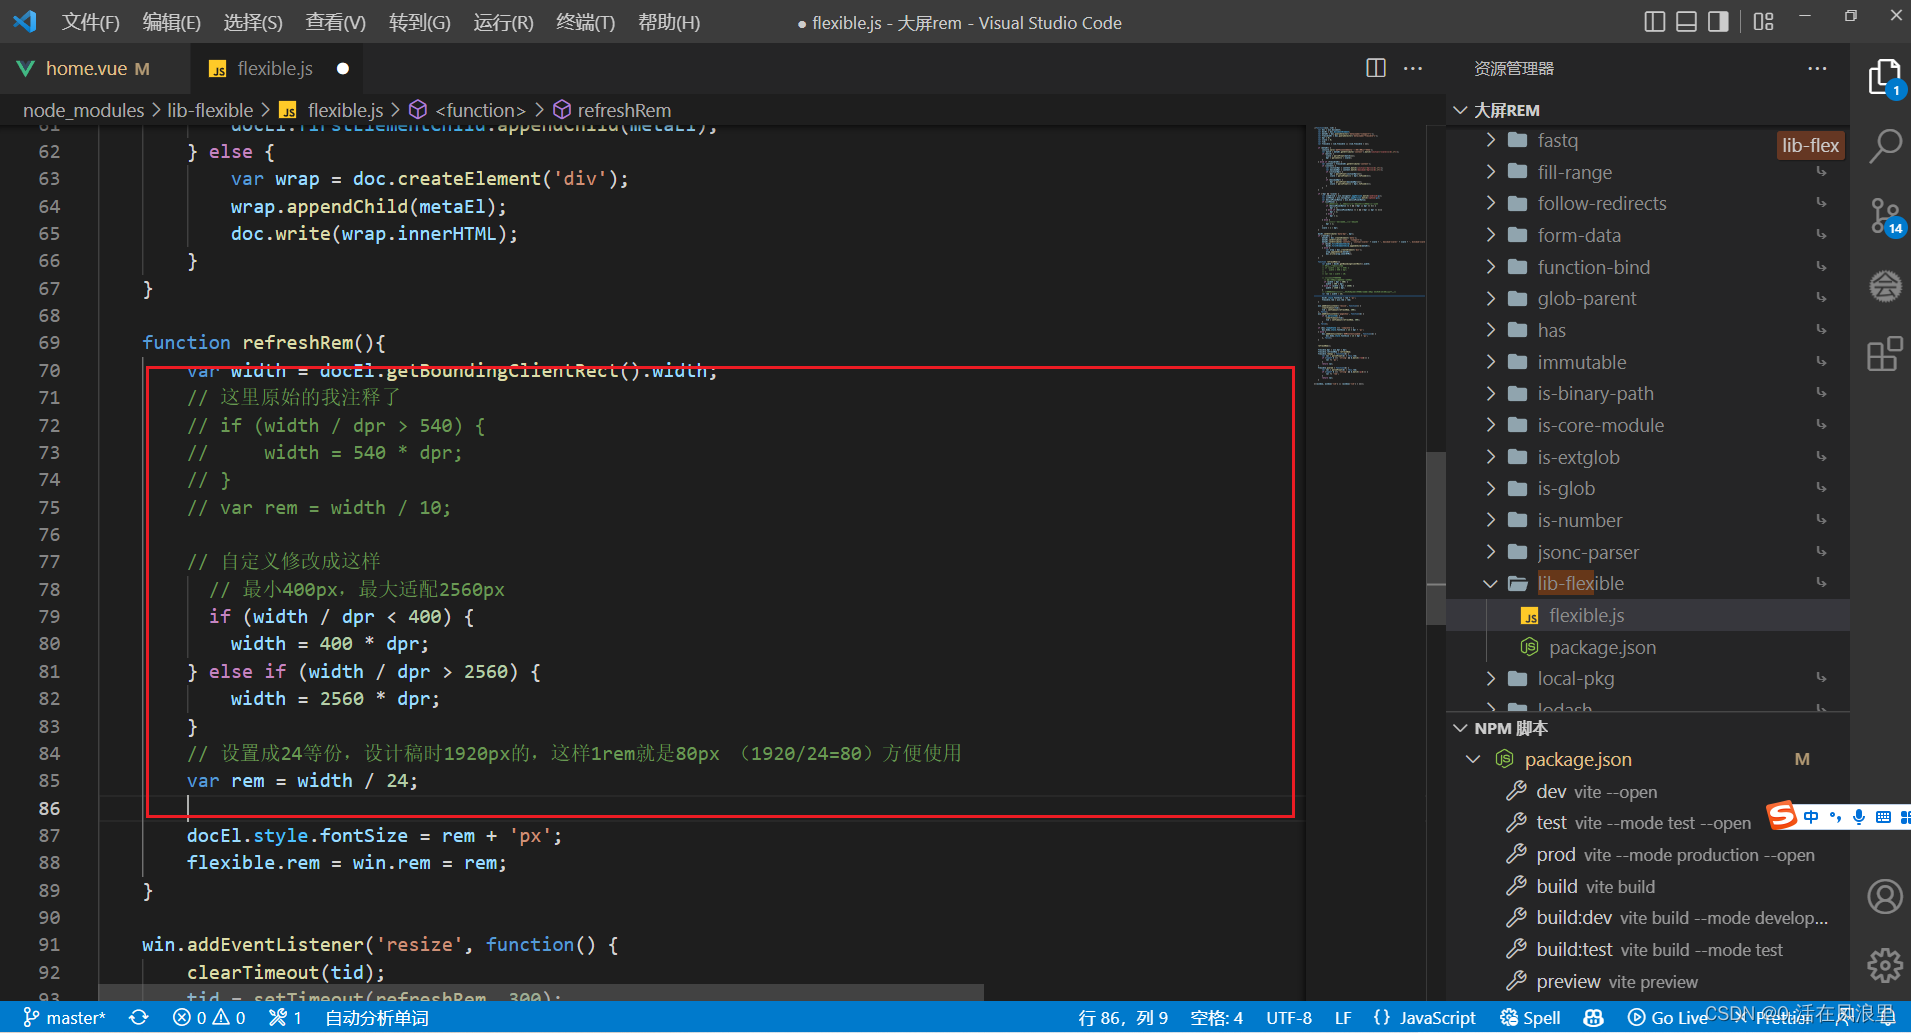
?三:在main引入
import { createApp } from 'vue'
import App from './App.vue'
import router from './router'
import store from './store'
// 引用
import 'lib-flexible/flexible.js'

createApp(App).use(store).use(router).mount('#app')
这个时候重启项目大家打开浏览器调试器 即可发现在浏览器大小改变的时候 在html根节点上会自动设置一个font-size
四:cssrem插件
我们在写代码的时候发现如果我们都根据80px为1rem,在编写代码的时候手动转换,非常的麻烦 所以我们可以在vscode中安装一个cssrem的插件帮助我们进行转换 这样一来开发过程中会更加的方便
cssrem插件配置
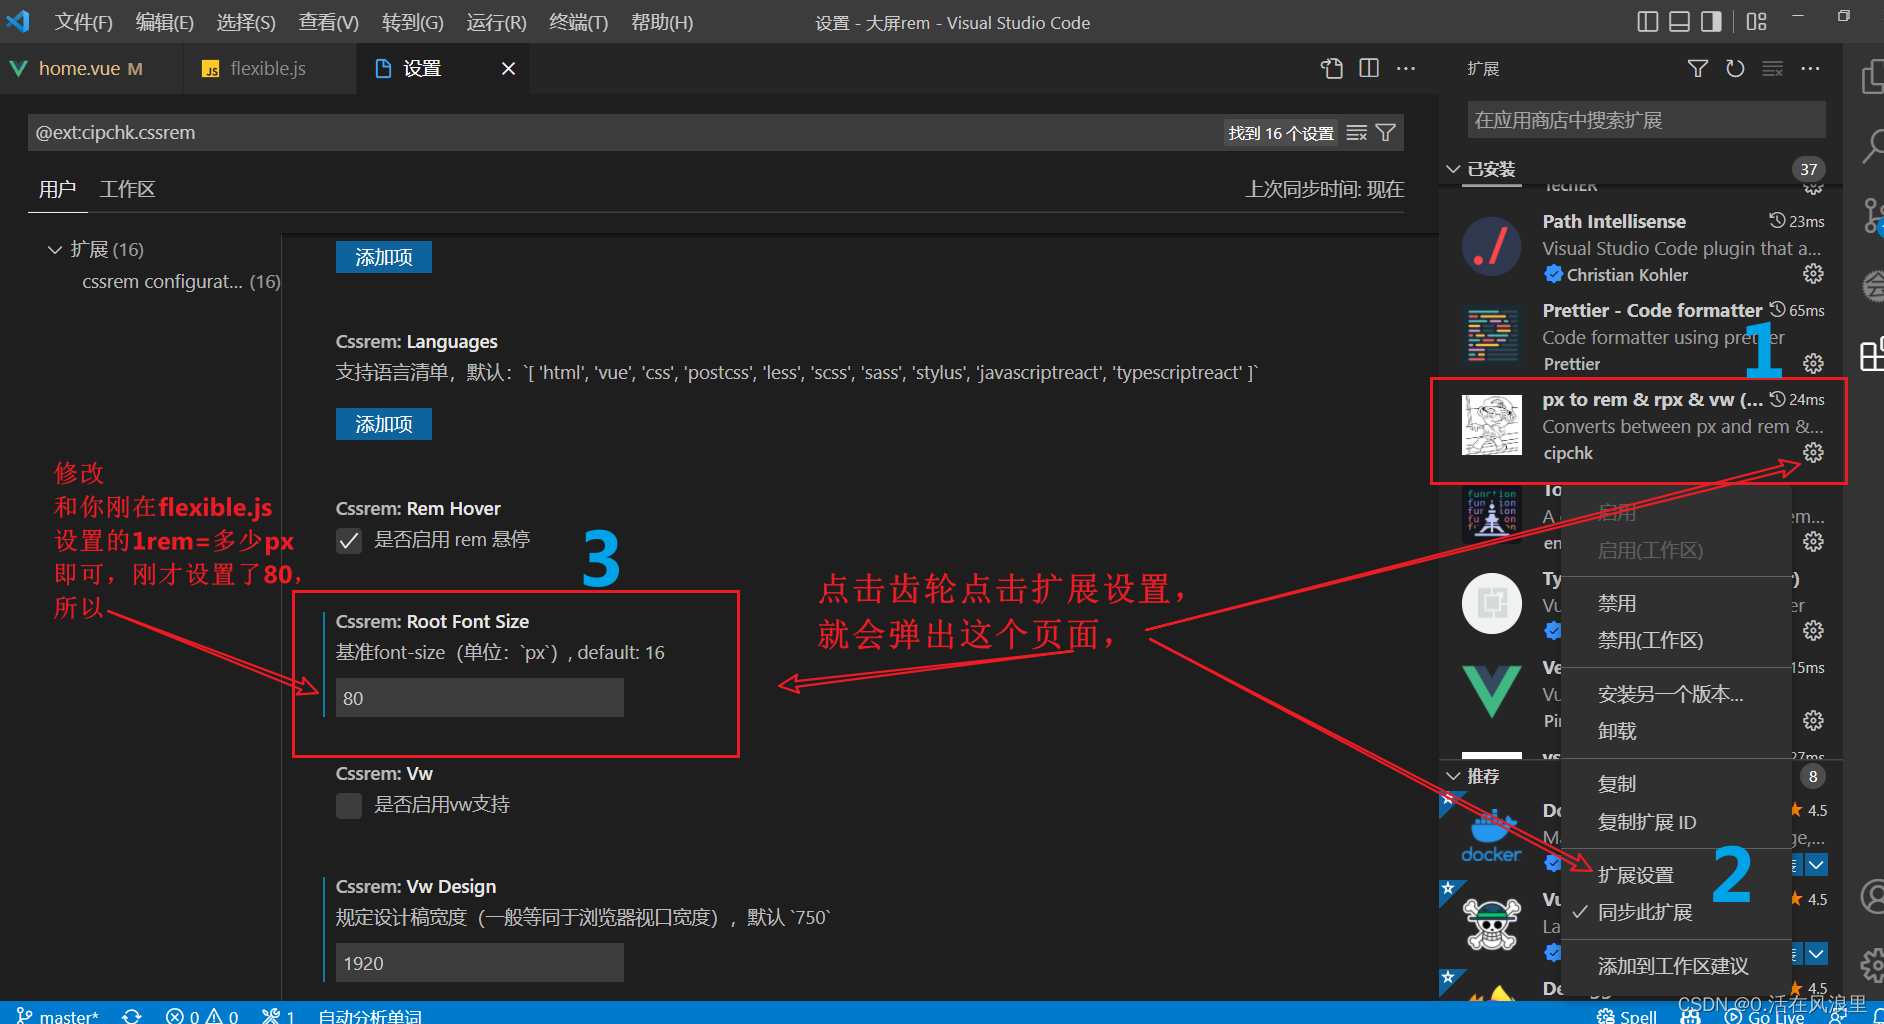
在vscode扩展中找到 cssrem插件 最新名字叫px to rem & rpx 安装到vscode中 点击右下角设置
修改Root Font Size(基准font-size) 配置项为80即可
?
?五:页面使用
?至此自适应? px转rem 前期已经完成!!!
六:卸载依赖,复制?flexible.js
但是你想一下,我们修改了?node_module ,你将上传到git仓库,别人在拉下来,下载依赖安装,是不是有回到默认的node_module/lib-flexible/flexible.js 配置了,所以我们直接将flexible.js这个文件复制,放在项目中,在将?npm uninstall lib-flexible 卸载了
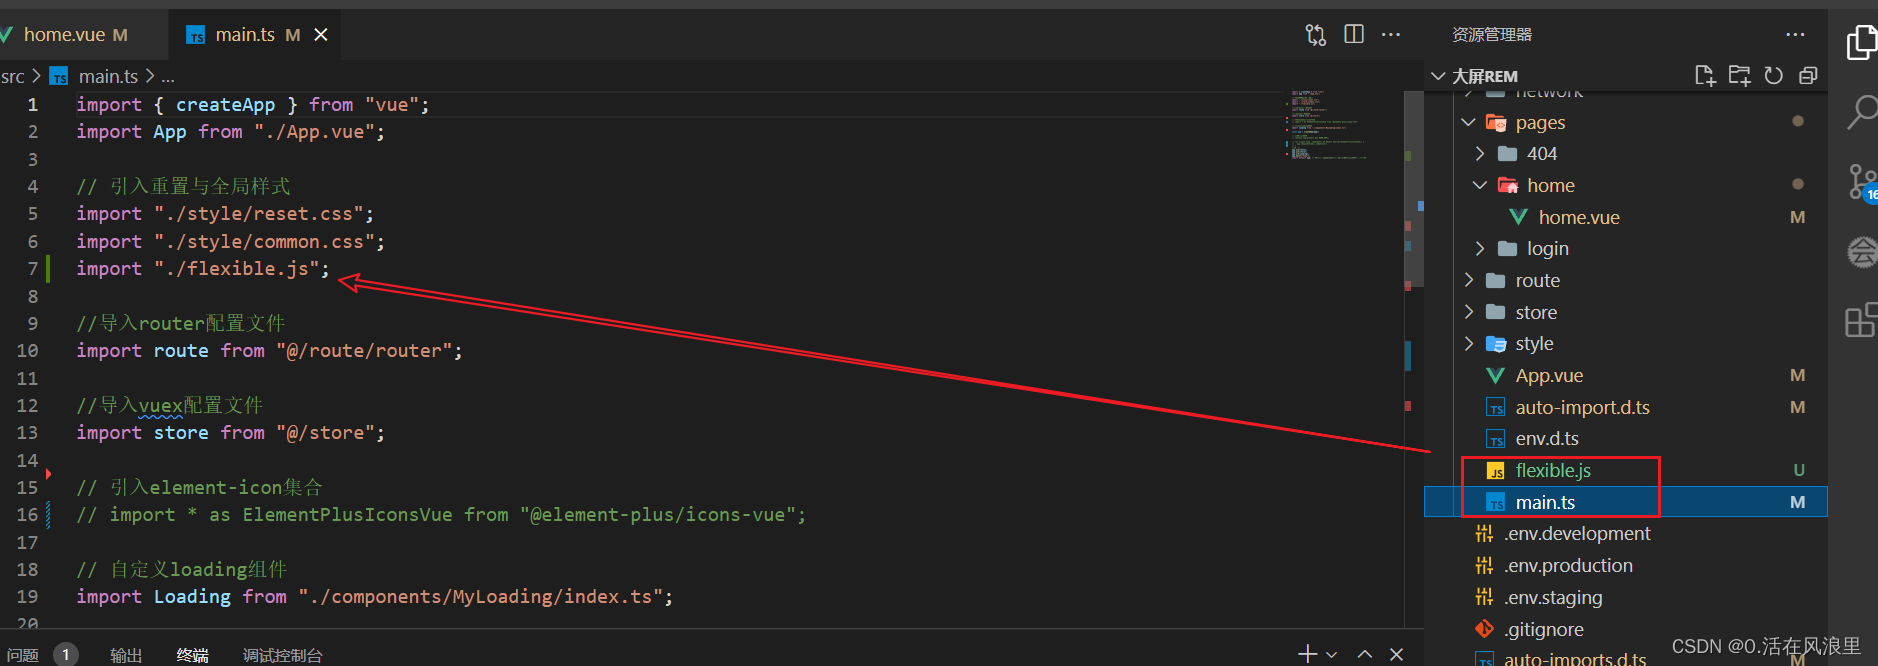
?配置完成!!!
配置最小最大宽高?
现在就可以在页面开始书写代码了,注意最大最小宽高需要配合@media,最大最小宽高 只能使用px单位,
比如:我需要小于我笔记本宽/高度就不在缩小,
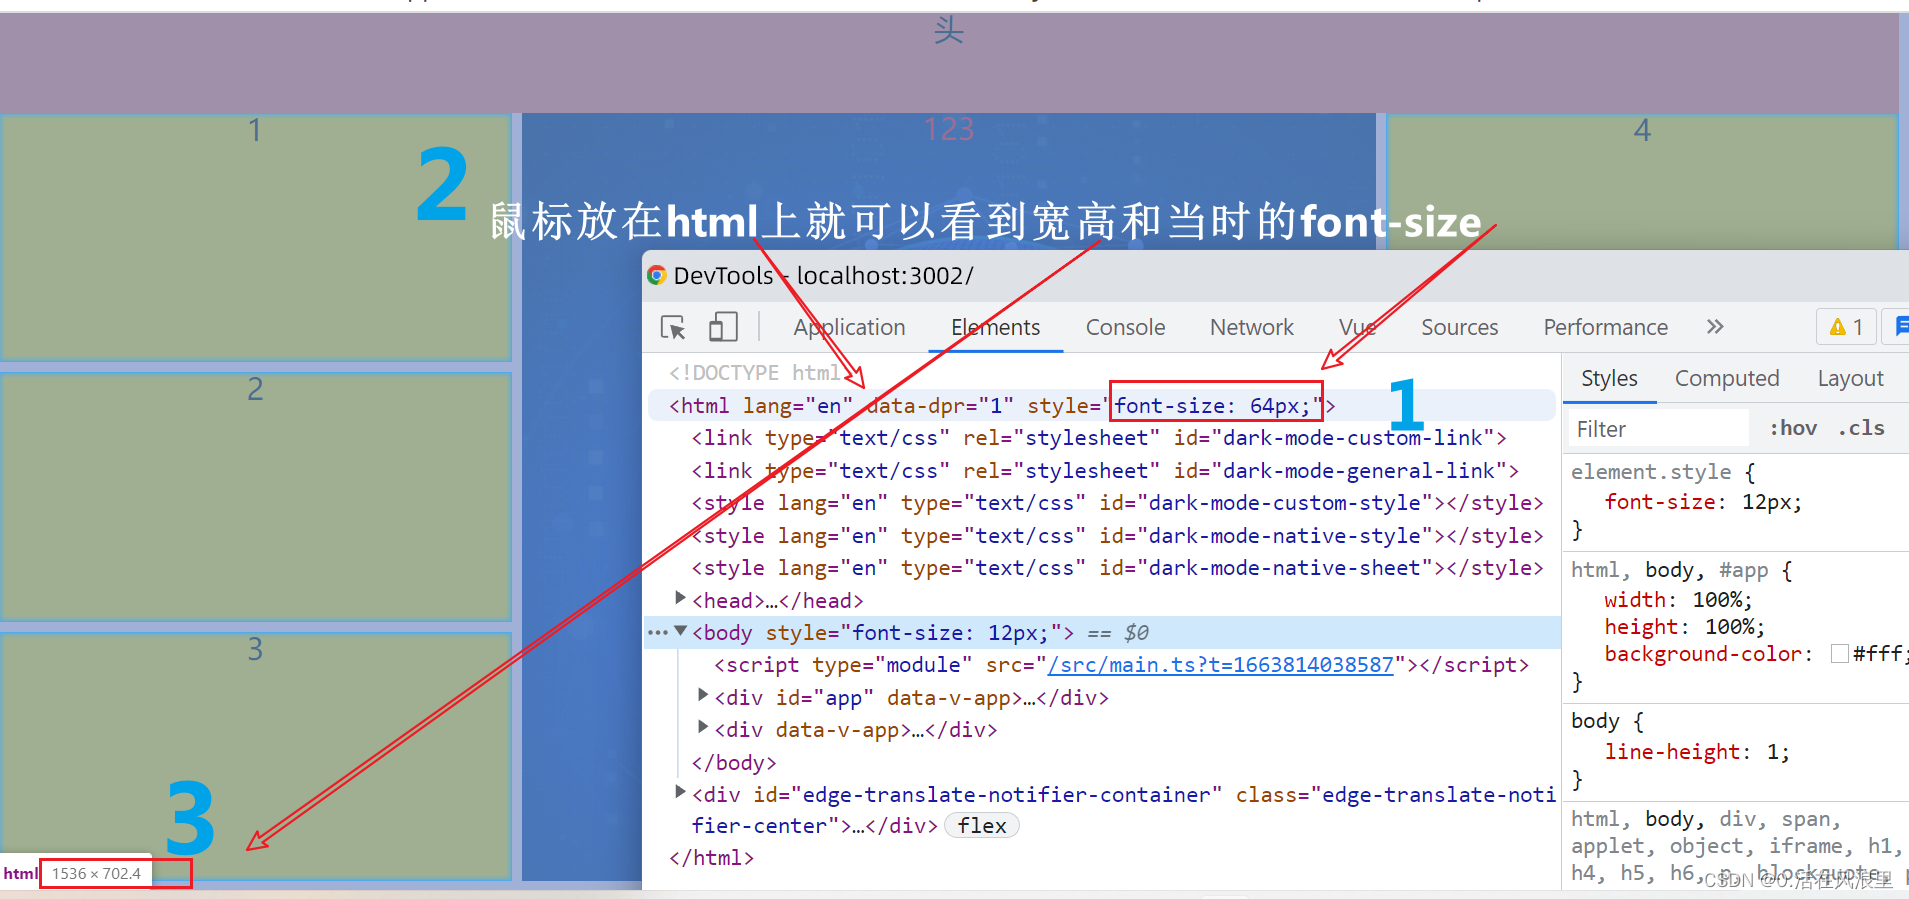
?记录此时到宽高和font-size
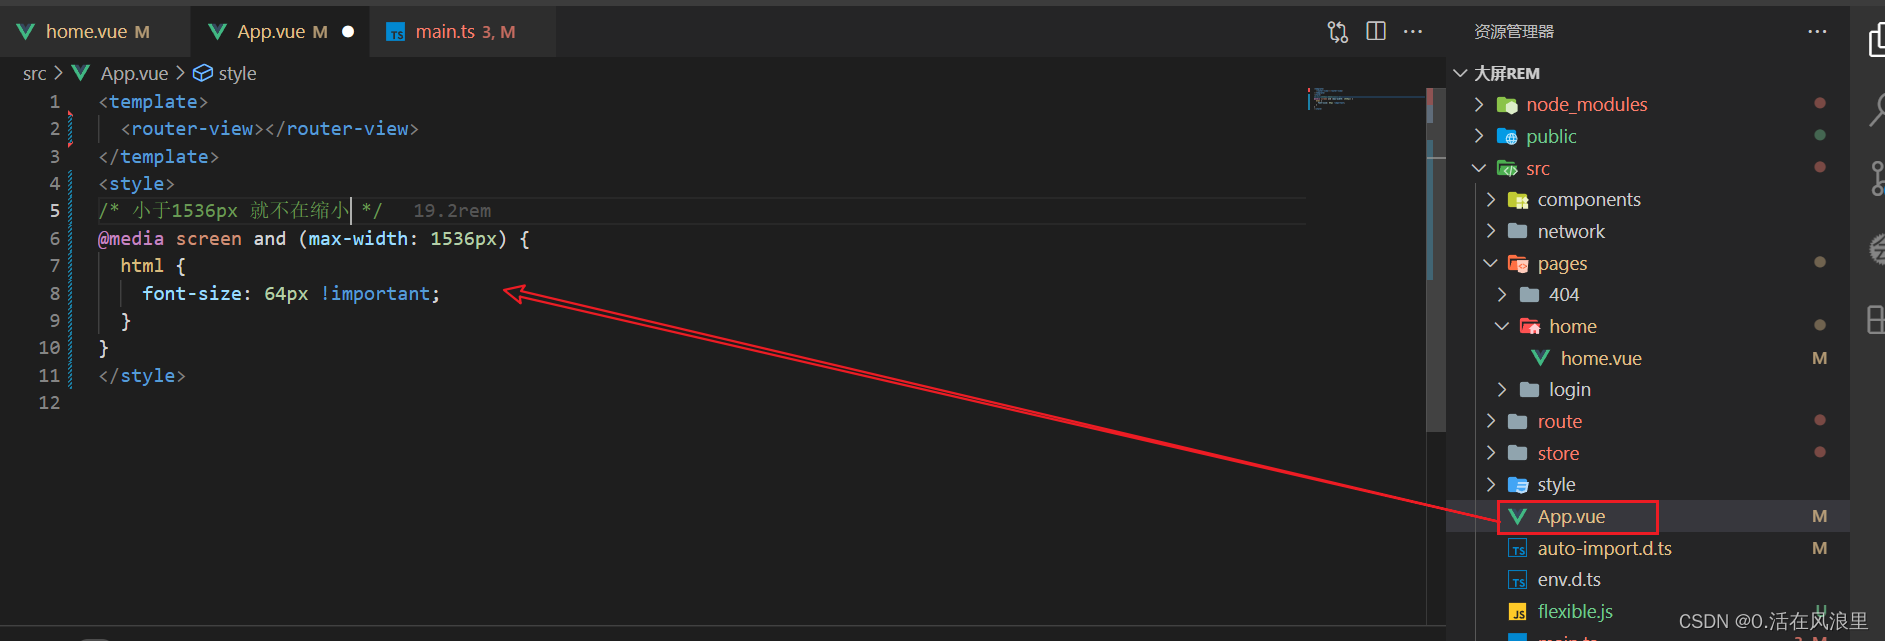
最大的外层容器设置最大最小宽高

app.vue设置font-size,不然?虽然限制了最大最小宽但是页面比例还会缩小
?
?下面写入地图
? ? ? ? ? ? ? ? ?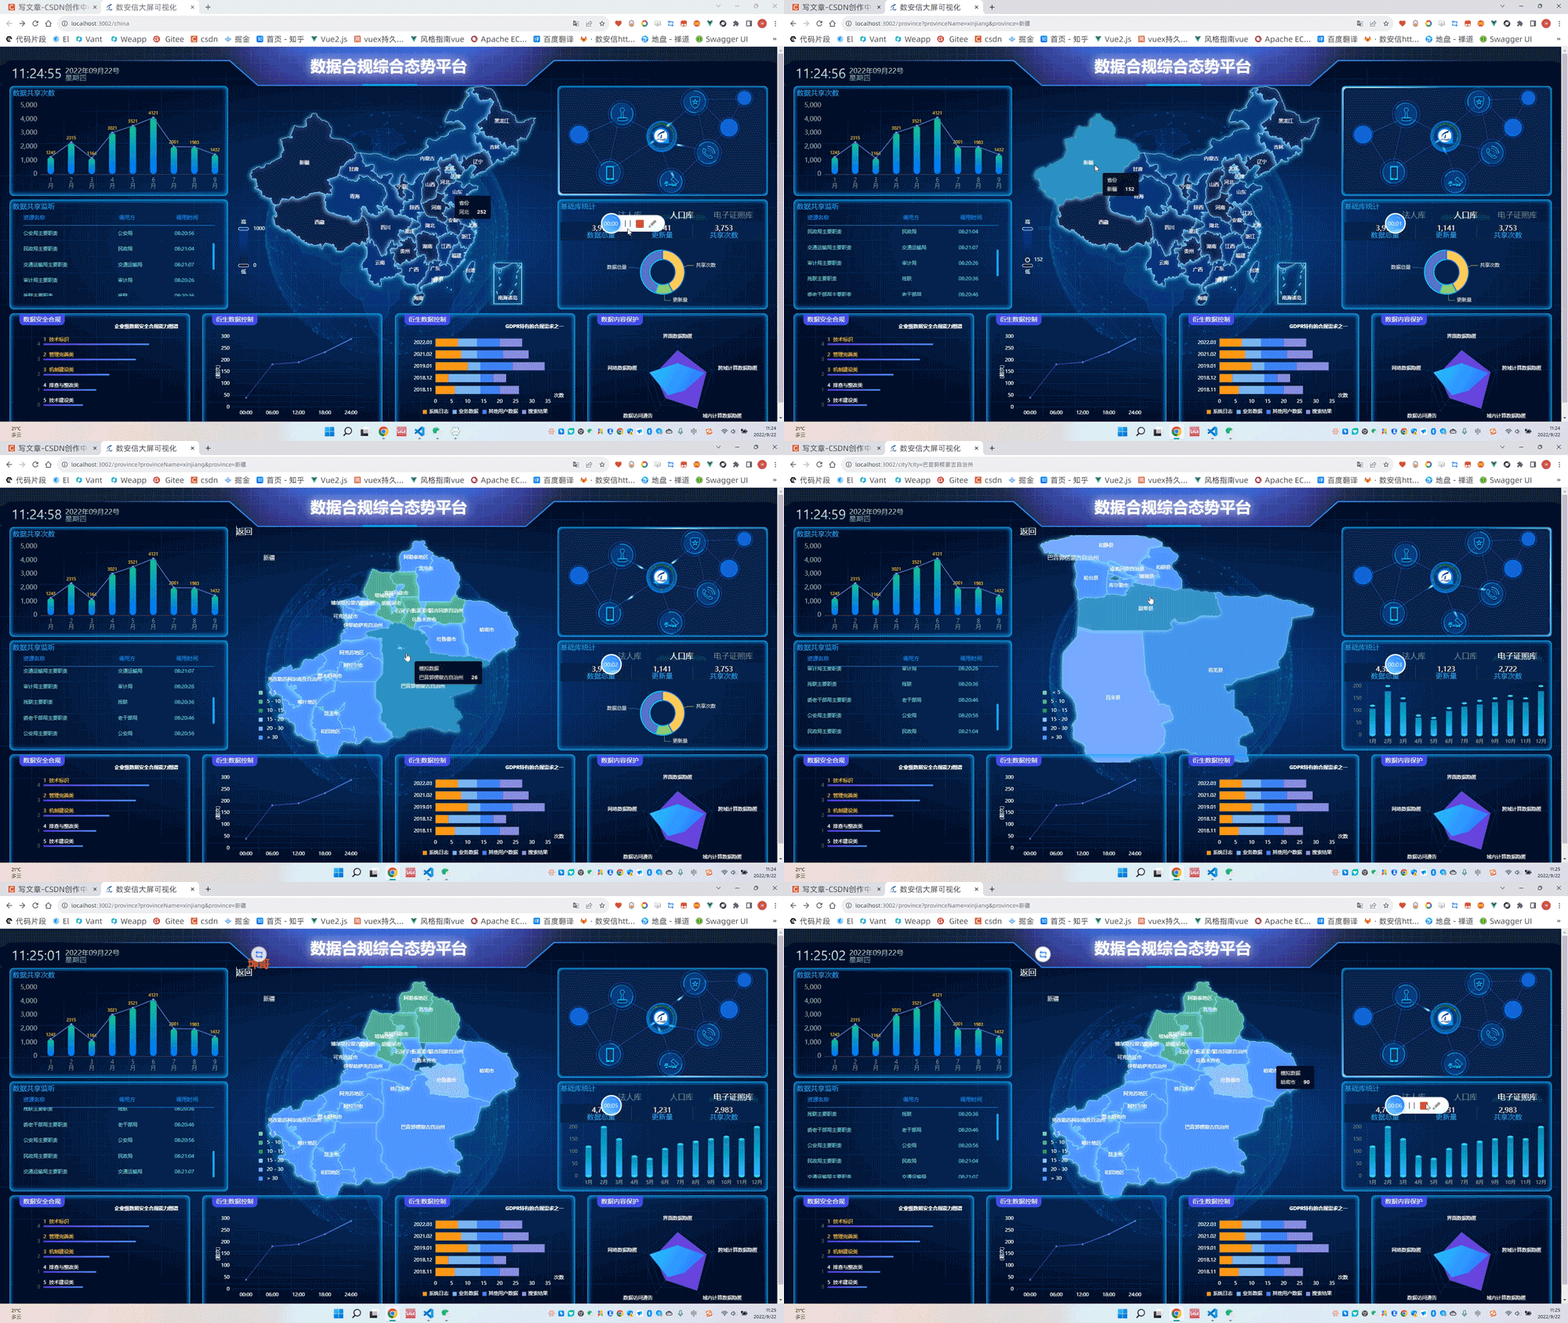 ? ? ? ? ? ? ? ? ? ? ? ? ? ? ? ??
?第一:地图是由点组成线!线组成图!
?第二:如果每块的地图区域标识的文字不在居中位置可以在对应的地图json中调节cp !
?第三:地图数据在?DataV.GeoAtlas地理小工具系列?可以下载 !
?第四:目前地图全是静态json文件,假如要打包,可能会路径不对,所以放置的位置建议在publick中
?第五:省、城、乡镇地图基于中国地图的json,所以第一步要有中国地图的json!
念及此!我将一步步展示地图,必须一遍回,一边懂
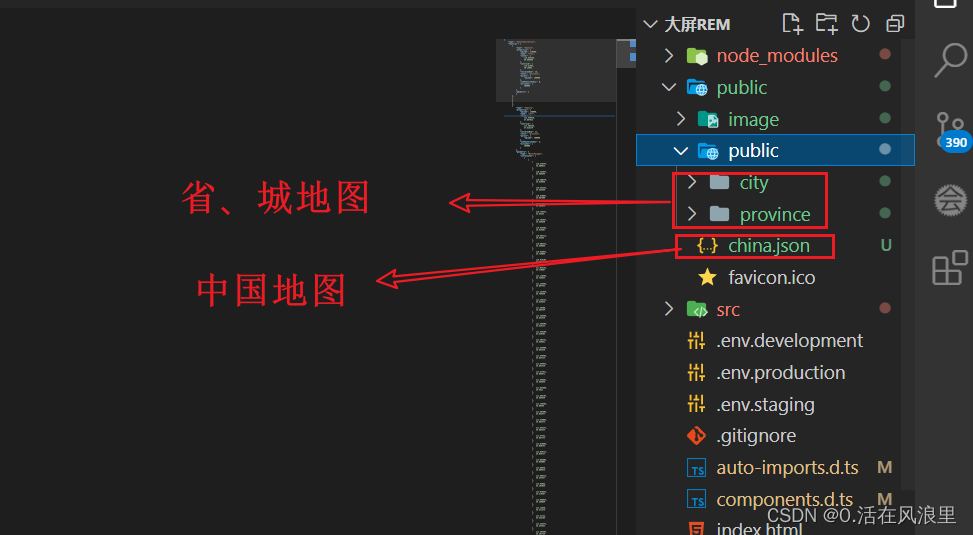
?路由如下
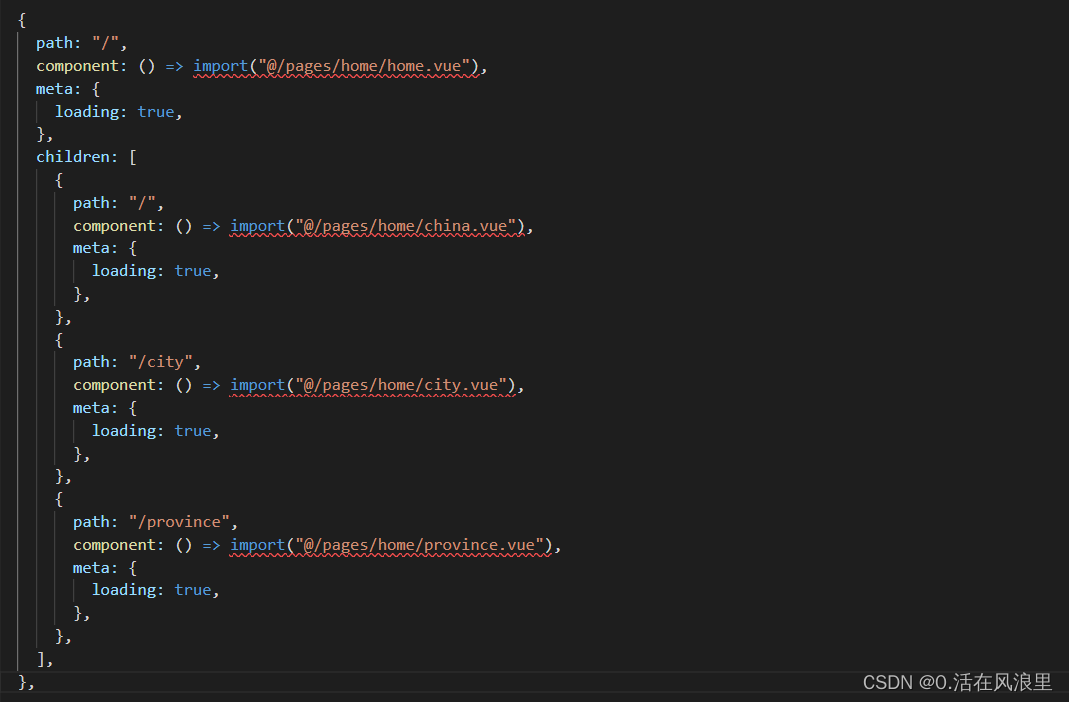
因为地图里所有页面是home的children ,所以在页面使用<router-view></router-view>用于展示地地图

每行重要的地方都有注释,总结:将所需的地图文件准备好,配好路由,建好页面,基本就成了,到此也就基本结束了,最后祝大家2022 越来越强 我会吧项目上传,也把代码全部贴到博文中,希望大家bug减少,早早下班
china.vue
<template>
  <!-- 中国地图 省级 一级页面 -->
  <div id="main"></div>
</template>

<script setup>
import * as echarts from "echarts";
import jsonData from "../../../public/china.json";
import { onMounted, reactive } from "vue";
import { useRouter } from "vue-router";
const router = useRouter();

let state = reactive({
  // ename为了获取省份的名字
  dataList: [
    { ename: "nanhaizhudao", name: "南海诸岛" },
    { ename: "beijing", name: "北京" },
    { ename: "tianjin", name: "天津" },
    { ename: "shanghai", name: "上海" },
    { ename: "chongqing", name: "重庆" },
    { ename: "hebei", name: "河北" },
    { ename: "henan", name: "河南" },
    { ename: "yunnan", name: "云南" },
    { ename: "liaoning", name: "辽宁" },
    { ename: "heilongjiang", name: "黑龙江" },
    { ename: "hunan", name: "湖南" },
    { ename: "anhui", name: "安徽" },
    { ename: "shandong", name: "山东" },
    { ename: "xinjiang", name: "新疆" },
    { ename: "jiangsu", name: "江苏" },
    { ename: "zhejiang", name: "浙江" },
    { ename: "jiangxi", name: "江西" },
    { ename: "hubei", name: "湖北" },
    { ename: "guangxi", name: "广西" },
    { ename: "gansu", name: "甘肃" },
    { ename: "jin", name: "山西" },
    { ename: "neimenggu", name: "内蒙古" },
    { ename: "shanxi", name: "陕西" },
    { ename: "jilin", name: "吉林" },
    { ename: "fujian", name: "福建" },
    { ename: "guizhou", name: "贵州" },
    { ename: "guangdong", name: "广东" },
    { ename: "qinghai", name: "青海" },
    { ename: "xizang", name: "西藏" },
    { ename: "sichuan", name: "四川" },
    { ename: "ningxia", name: "宁夏" },
    { ename: "hainan", name: "海南" },
    { ename: "taiwan", name: "台湾" },
    { ename: "xianggang", name: "香港" },
    { ename: "aomen", name: "澳门" },
  ],
});

onMounted(() => {
  let dataList = state.dataList;
  // 模拟数据,给dataList添加一个随机的value值
  for (let i = 0; i < dataList.length; i++) {
    dataList[i].value = Math.floor(Math.random() * 1000 - 1);
  }
  var myChart = echarts.init(document.getElementById("main"));
  // 注册中国地图 第一个参数为地图的名字,第二个参数为地图的json数据,第一个要和geo map一样
  echarts.registerMap("china", jsonData);
  // 配置项
  var option = {
    tooltip: {
      show: true,
      trigger: "item",
      alwaysShowContent: false,
      backgroundColor: "#0C121C",
      borderColor: "rgba(0, 0, 0, 0.16);",
      hideDelay: 100,
      triggerOn: "mousemove",
      enterable: true,
      formatter: "",
      textStyle: {
        color: "#DADADA",
        fontSize: "12",
        width: 20,
        height: 30,
        overflow: "break",
      },
      showDelay: 100,
    },

    visualMap: {
      min: 0,
      max: 1000,
      text: ["高", "低"], //两端的文本
      realtime: false,
      calculable: true,
      itemWidth: 20, //图形的宽度,即长条的宽度。
      itemHeight: 90, //图形的高度,即长条的高度。
      align: "auto", //指定组件中手柄和文字的摆放位置.可选值为:‘auto’ 自动决定。‘left’ 手柄和label在右。‘right’ 手柄和label在左。‘top’ 手柄和label在下。‘bottom’ 手柄和label在上。
      left: "left", //组件离容器左侧的距离,‘left’, ‘center’, ‘right’,‘20%’
      top: "60%", //组件离容器上侧的距离,‘top’, ‘middle’, ‘bottom’,‘20%’
      right: "auto", //组件离容器右侧的距离,‘20%’
      bottom: "auto", //组件离容器下侧的距离,‘20%’
      orient: "vertical", //图例排列方向
      inRange: {
        color: ["#141c48", "#0d3d86"],
      },
      //设置字体颜色
      textStyle: {
        color: "#ffffff",
      },
    },
    geo: {
      map: "china",
      roam: true, //是否开启平游或缩放
      zoom: 0.9, //当前视角的缩放比例
      emphasis: {
        label: {
          color: "#fff",
        },
        // 鼠标放上高亮样式
        itemStyle: {
          areaColor: "#389BB7",
          borderWidth: 0,
        },
      },
      label: {
        // 通常状态下的样式
        show: true,
        color: "#fff",
        // 鼠标放上去的样式
      },
      // 地图区域的样式设置
      itemStyle: {
        borderColor: "rgba(147, 235, 248, 1)",
        borderWidth: 1,
        areaColor: {
          type: "radial",
          x: 0.5,
          y: 0.5,
          r: 0.8,
          colorStops: [
            {
              offset: 0,
              color: "rgba(147, 235, 248, 0)", // 0% 处的颜色
            },
            {
              offset: 1,
              color: "rgba(147, 235, 248, .2)", // 100% 处的颜色
            },
          ],
          globalCoord: false,
        },
        shadowColor: "rgba(128, 217, 248, 1)",
        shadowOffsetX: -2,
        shadowOffsetY: 2,
        shadowBlur: 10,
      },
      layoutCenter: ["50%", "50%"],
      layoutSize: "100%",
    },
    // 鼠标悬浮提示框
    series: [
      {
        name: "省份",
        type: "map",
        geoIndex: 0,
        data: dataList,
      },
    ],
  };
  //设置配置项
  myChart.setOption(option);
  // 点击事件地图 enmae为获取省地图的json数据
  myChart.on("click", function (params) {
    // console.log("😂👨🏾????👨🏼==>: ", params.data.ename, params.name);  //===>打印后类似 xinjiang 新疆
    router.push({
      path: "/province",
      query: { provinceName: params.data.ename, province: params.name },
    });
  });
  // 缩放适应
  window.addEventListener("resize", () => {
    myChart.resize();
  });
});
</script>
<style scoped>
#main {
  width: 100%;
  height: 100%;
  margin:-20px auto;
}
</style>
?city.vue
<template>
  <!-- 中国地图 渲染县级 三级页面 接受来自市点击的name,渲染不同市json-->
  <div @click="$router.go(-1)" style="color: #fff; font-size: .25rem">返回</div>
  <div class="tip" v-if="state.cityId === undefined">
    敬请谅解,乡镇数据正在努力更新中...
  </div>
  <!-- echarts的容器 -->
  <div :id="state.id" class="cityCharts"></div>
</template>

<script setup>
import * as echarts from "echarts";

import axios from "axios";

import { onMounted, reactive, ref } from "vue";

// useRoute() 用于获取当前路由信息(路由实例对象) useRouter() 路由跳转对象
import { useRouter, useRoute } from "vue-router";
const router = useRouter();
const route = useRoute();

// 引入定义的js,方便动态引入json
import { cityMap } from "../../../public/public/city/china-main-city-map";

let state = reactive({
  cityId: null,
  id: "echarts_" + new Date().getTime() + Math.floor(Math.random() * 1000),
  myChart: null,
  option: {
    // 背景颜色
    // backgroundColor: "#0b1c3e",
    title: {
      text: "",
      top: "8%",
      left: "8%",
      textStyle: {
        fontSize: 14,
        fontWeight: 300,
        color: "#fff",
      },
    },
    // 提示浮窗样式
    tooltip: {
      show: true,
      trigger: "item",
      alwaysShowContent: false,
      backgroundColor: "#0C121C",
      borderColor: "rgba(0, 0, 0, 0.16);",
      hideDelay: 100,
      triggerOn: "mousemove",
      enterable: true,
      formatter: "",
      textStyle: {
        color: "#DADADA",
        fontSize: "12",
        width: 20,
        height: 30,
        overflow: "break",
      },
      showDelay: 100,
    },

    visualMap: {
      //分段型视觉映射组件
      show: true,
      type: "piecewise",
      left: 50,
      bottom: 50,
      showLabel: true,
      itemWidth: 10,
      itemHeight: 10,
      inverse: true,
      color: "#fff",
      textStyle: {
        color: "#ffffff",
      },
      // lt:小于; lte:小于等于; gt:大于; gte:大于等于;
      pieces: [
        {
          lt: 5,
          label: " < 5",
          color: "#83CBAC",
        },
        {
          gte: 5,
          lte: 10,
          label: "5 - 10",
          color: "#55BB8A",
        },
        {
          gt: 10,
          lte: 15,
          label: "10 - 15",
          color: "#20A162",
        },
        {
          gt: 15,
          lte: 20,
          label: "15 - 20",
          color: "#9ABEFA",
        },
        {
          gt: 20,
          lte: 30,
          label: "20 - 30",
          color: "#78A9F9",
        },
        {
          gt: 30,
          label: "> 30",
          color: "#5693F7",
        },
      ],
    },

    // 地图配置
    geo: {
      map: "",
      roam: true, //是否开启平游或缩放
      zoom: 0.9, //当前视角的缩放比例
      emphasis: {
        label: {
          color: "#fff",
        },
        // 鼠标放上高亮样式
        itemStyle: {
          areaColor: "#389BB7",
          borderWidth: 0,
        },
      },
      label: {
        // 通常状态下的样式
        show: true,
        color: "#fff",
        // 鼠标放上去的样式
      },
      // 地图区域的样式设置
      itemStyle: {
        borderColor: "rgba(147, 235, 248, 1)",
        borderWidth: 1,
        areaColor: {
          type: "radial",
          x: 0.5,
          y: 0.5,
          r: 0.8,
          colorStops: [
            {
              offset: 0,
              color: "rgba(147, 235, 248, 0)", // 0% 处的颜色
            },
            {
              offset: 1,
              color: "rgba(147, 235, 248, .2)", // 100% 处的颜色
            },
          ],
          globalCoord: false, // 缺省为 false
        },
        shadowColor: "rgba(128, 217, 248, 1)",
        shadowOffsetX: -2,
        shadowOffsetY: 2,
        shadowBlur: 10,
      },
      layoutCenter: ["50%", "50%"],
      layoutSize: "100%",
    },

    series: [
      {
        name: "模拟数据",
        type: "map",
        geoIndex: 0, // 不可缺少,否则无tooltip 指示效果
        data: [{ name: "", value: "" }],
      },
    ],
  },
});

onMounted(async () => {
  // console.log(route.query);
  /*  接受来自province.vue的参数:
     console.log(route.query);  打印后====》类似 {city: '哈密市'}*/
  const city = route.query.city;

  // 设置地图标题
  state.option.title.text = city;
  // 设置地图
  state.option.geo.map = city;
  // 第二种方式通过js文件引入json
  state.cityId = cityMap[city];

  // console.log(state.cityId);
  // 初始化echarts
  state.myChart = echarts.init(document.getElementById(state.id));
  if (state.cityId === undefined) return;

  await axios.get(`/public/city/${state.cityId}.json`).then((res) => {
    // console.log('\😂👨🏾????👨🏼==>: ',res);
    // 地图注册,第一个参数的名字必须和option.geo.map一致,第二个参数是地图json数据
    echarts.registerMap(city, res.data);
    res.data.features.forEach((item) => {
      // console.log(item);
      // series是数组里面data是一个对象,所以要用series[0].data.push
      state.option.series[0].data.push({
        name: item.properties.name,
        value: Math.floor(Math.random() * 100),
      });
    });
    state.myChart.setOption(state.option);
  });

  // state.myChart.on("click", function (params) {
  //   console.log("😂👨🏾????👨🏼==>: ", params);
  // });
  // 自适应
  window.addEventListener("resize", () => {
    myChart.resize();
  });
});
</script>
<style>
.cityCharts {
  width: 100%;
  height: 100%;
  margin: 0 auto;
}
.tip {
  text-align: center;
  margin-top: .375rem;
  color: #fff;
  font-size: .1875rem;
}
</style>
home.vue
<template>
  <div class="content-wrap">
    <header>头</header>
    <div class="content-main">
      <div class="left">
        <div>1</div>
        <div>2</div>
        <div>3</div>
      </div>
      <div class="center-map-wrap">
        <img src="image/home/map.png" class="map" />
        <img src="image/home/link.png" class="link" />
        <div class="map-main">
          <router-view></router-view>
        </div>
      </div>
      <div class="right">
        <div>4</div>
        <div>5</div>
        <div>6</div>
      </div>
    </div>
  </div>
</template>
<script setup></script>
<style lang="scss" scoped>
// 方便看清文字,可删除
div {
  text-align: center;
  font-size: 0.375rem;
}
.content-wrap {
  width: 100%;
  height: 100%;
  // 最大最小宽/高 不能转rem
  min-width: 1536px;
  min-height: 702px;
  margin: 0 auto;
  padding: 0 0.125rem 0.125rem 0.125rem;
  background-color: pink;
  header {
    width: 100%;
    height: 1.25rem;
    background-color: tomato;
  }
  .content-main {
    display: flex;
    justify-content: space-between;
    height: calc(100% - 1.25rem);
    width: 100%;
    .left,
    .right {
      display: flex;
      flex-direction: column;
      flex: 3;
      height: 100%;
      div {
        flex: 1;
        border: 0.0125rem solid #1bb4f9;
        box-shadow: #1bb4f9 0rem 0rem 0.0625rem 0.0125rem inset;
        background-color: rgb(255, 191, 0);
        &:nth-child(2) {
          margin: 0.125rem 0;
        }
      }
    }
    .center-map-wrap {
      position: relative;
      overflow: hidden;
      flex: 5;
      margin: 0 0.125rem;
      background: url("image/home/bg.jpg") no-repeat center center;
      img {
        position: absolute;
      }
      .map {
        animation: run1 50s infinite linear;
        width: 6.25rem;
        height: 6.25rem;
        top: 1.525rem;
        left: 2.5625rem;
      }

      .link {
        width: 7.5rem;
        height: 7.5rem;
        animation: run 45s infinite linear;
        transform-origin: center center;
        z-index: 5;
        top: 1.025rem;
        left: 1.9375rem;
      }

      @keyframes run {
        from {
          transform: rotate(360deg);
        }

        to {
          transform: rotate(-360deg);
        }
      }

      @keyframes run1 {
        from {
          transform: rotate(-360deg);
        }

        to {
          transform: rotate(360deg);
        }
      }
      .map-main {
        position: relative;
        z-index: 10;
        width: 100%;
        height: 100%;
      }
    }
  }
}
</style>
province.vue
<template>
  <!-- 中国地图 展示市 二级页面 接受来自省点击的ename,渲染不同省json-->
  <div @click="$router.go(-1)" style="color: #fff; font-size: .25rem">返回</div>
  <!-- echarts 容器 -->
  <div :id="state.id" class="provinceCharts"></div>
</template>

<script setup>
import * as echarts from "echarts";

import axios from "axios";

import { onMounted, reactive, ref } from "vue";

// useRoute() 用于获取当前路由信息(路由实例对象) useRouter() 路由跳转对象
import { useRouter, useRoute } from "vue-router";
const router = useRouter();
const route = useRoute();
// 定义echarts的数据
let state = reactive({
  id: "echarts_" + new Date().getTime() + Math.floor(Math.random() * 1000),
  myChart: null,
  option: {
    // 背景颜色
    // backgroundColor: "#0b1938",
    title: {
      text: "",
      top: "8%",
      left: "8%",
      textStyle: {
        fontSize: 14,
        fontWeight: 300,
        color: "#fff",
      },
    },
    // 提示浮窗样式
    tooltip: {
      show: true,
      trigger: "item",
      alwaysShowContent: false,
      backgroundColor: "#0C121C",
      borderColor: "rgba(0, 0, 0, 0.16);",
      hideDelay: 100,
      triggerOn: "mousemove",
      enterable: true,
      formatter: "",
      textStyle: {
        color: "#DADADA",
        fontSize: "12",
        width: 20,
        height: 30,
        overflow: "break",
      },
      showDelay: 100,
    },

    visualMap: {
      //分段型视觉映射组件
      show: true,
      type: "piecewise",
      left: 50,
      bottom: 50,
      showLabel: true,
      itemWidth: 10,
      itemHeight: 10,
      inverse: true,
      //设置字体颜色
      textStyle: {
        color: "#ffffff",
      },
      // 图例
      // lt:小于; lte:小于等于; gt:大于; gte:大于等于;
      pieces: [
        {
          lt: 5,
          label: " < 5",
          color: "#83CBAC",
        },
        {
          gte: 5,
          lte: 10,
          label: "5 - 10",
          color: "#55BB8A",
        },
        {
          gt: 10,
          lte: 15,
          label: "10 - 15",
          color: "#20A162",
        },
        {
          gt: 15,
          lte: 20,
          label: "15 - 20",
          color: "#9ABEFA",
        },
        {
          gt: 20,
          lte: 30,
          label: "20 - 30",
          color: "#78A9F9",
        },
        {
          gt: 30,
          label: "> 30",
          color: "#5693F7",
        },
      ],
    },

    // 地图配置
    geo: {
      map: "", //会从点击的省份的ename中获取
      roam: true, //是否开启平游或缩放
      zoom: 0.9, //当前视角的缩放比例
      emphasis: {
        label: {
          color: "#fff",
        },
        // 鼠标放上高亮样式
        itemStyle: {
          areaColor: "#389BB7",
          borderWidth: 0,
        },
      },
      label: {
        // 通常状态下的样式
        show: true,
        color: "#fff",
        // 鼠标放上去的样式
      },
      // 地图区域的样式设置
      itemStyle: {
        borderColor: "rgba(147, 235, 248, 1)",
        borderWidth: 1,
        areaColor: {
          type: "radial",
          x: 0.5,
          y: 0.5,
          r: 0.8,
          colorStops: [
            {
              offset: 0,
              color: "rgba(147, 235, 248, 0)", // 0% 处的颜色
            },
            {
              offset: 1,
              color: "rgba(147, 235, 248, .2)", // 100% 处的颜色
            },
          ],
          globalCoord: false,
        },
        shadowColor: "rgba(128, 217, 248, 1)",
        shadowOffsetX: -2,
        shadowOffsetY: 2,
        shadowBlur: 10,
      },
      layoutCenter: ["50%", "50%"],
      layoutSize: "100%",
    },

    series: [
      {
        name: "模拟数据",
        type: "map",
        geoIndex: 0, // 不可缺少,否则无tooltip 指示效果
        data: [{ name: "", value: "" }],
      },
    ],
  },
});

onMounted(async () => {
  /*  接受来自china.vue的参数:
     console.log(route.query);  打印后====》 { "provinceName": "xinjiang", "province": "新疆" } */
  const provinceName = route.query.provinceName;
  const province = route.query.province;

  // 设置地图标题
  state.option.title.text = province;
  // 设置地图
  state.option.geo.map = province;
  // 初始化echarts
  state.myChart = echarts.init(document.getElementById(state.id));
  // 根据china.vue点击的省份,传过来的名称(china定义的ename)获取数据(不同json)!!! 重要
  // 这里是第一种方式,通过上级定义的ename获取数据
  // city.vue中是第二种方式,通过单独的js文件的键值对的key获取对应的json
  await axios.get(`/public/province/${provinceName}.json`).then((res) => {
    /*
    地图注册 第一个参数是地图名称,第二个参数是地图json数据,第一参数要和goe.map的值一样
  (这里注册的地图和goe.map 是接受china点击的ename 都是动态赋值)
  */
    echarts.registerMap(province, res.data);
    // 模拟数据 series
    res.data.features.forEach((item) => {
      // series是数组里面data是一个对象,所以要用series[0].data.push
      state.option.series[0].data.push({
        name: item.properties.name,
        value: Math.round(Math.random() * 100),
      });
    });
    // 将定义的数据设置进myChart (myChary 是初始化echarts)
    state.myChart.setOption(state.option);
  });

  // 点击市数据跳转到区县数据
  state.myChart.on("click", (params) => {
    router.push({
      path: "/city",
      query: { city: params.name },
    });
  });
  // echarts适应屏幕大小
  window.addEventListener("resize", () => {
    myChart.resize();
  });
});
</script>
<style scoped>
.provinceCharts {
  width: 100%;
  height: 100%;
  margin: 0 auto;
}
</style>
