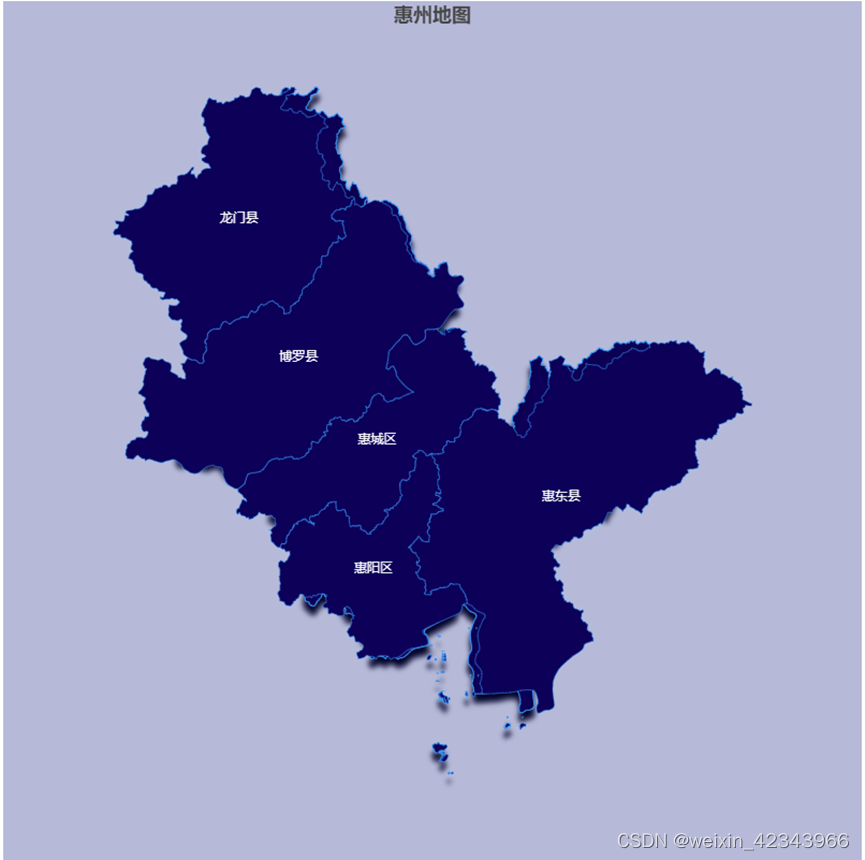
要实现一个市级的地图 ,首先先获取地图的json数据,一般通过
DataV.GeoAtlas地理小工具系列由阿里云DataV数据可视化团队出品,多年深耕数据可视化领域,数据大屏业务开拓者和领航者。致力用震撼而清晰的视觉语言,让更多人读懂大数据,受惠数据驱动的决策方式。![]() http://datav.aliyun.com/portal/school/atlas/area_selector这个网址去获取,它是阿里云的一个数据可视化平台,而地图数据是高德提供的。
http://datav.aliyun.com/portal/school/atlas/area_selector这个网址去获取,它是阿里云的一个数据可视化平台,而地图数据是高德提供的。
一、获取JSON文件
1、打开http://datav.aliyun.com/portal/school/atlas/area_selector
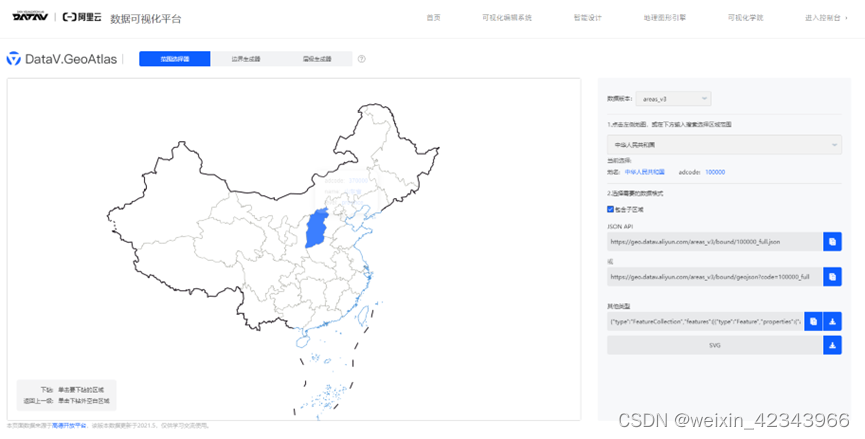
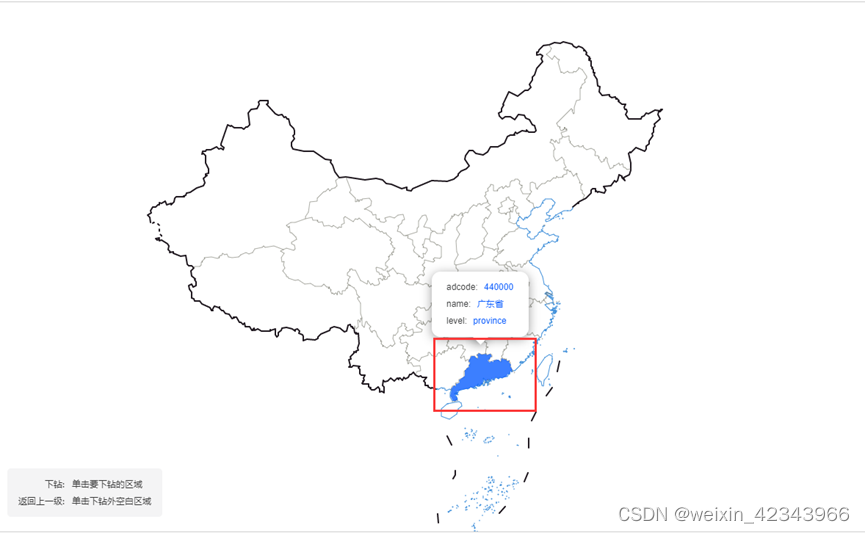
?2、点击选择自己想要的区域,例如点击了广东省,就会有广东省的轮廓显示出来
?3、可以精确到市,这个时候就可以下载json文件,选择的区域是省级的就可以下载到选择的那个省份的json文件,市级的话就是对应的市的json文件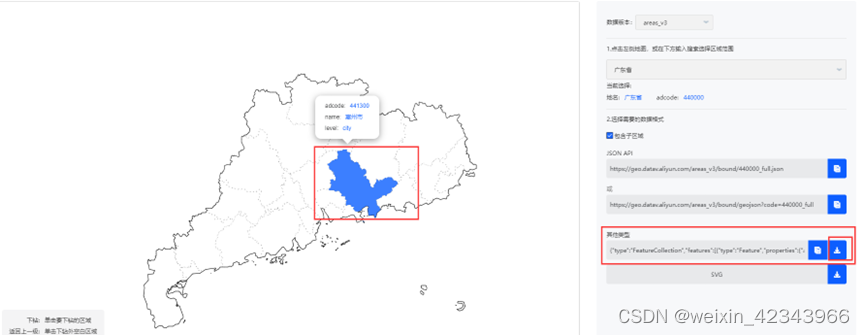
下载好的文件格式如下:

?
二、把JSON文件转换为js文件
1、新建js文件

2、把下面代码复制到js文件中
/*
 * Licensed to the Apache Software Foundation (ASF) under one
 * or more contributor license agreements.  See the NOTICE file
 * distributed with this work for additional information
 * regarding copyright ownership.  The ASF licenses this file
 * to you under the Apache License, Version 2.0 (the
 * "License"); you may not use this file except in compliance
 * with the License.  You may obtain a copy of the License at
 *
 *   http://www.apache.org/licenses/LICENSE-2.0
 *
 * Unless required by applicable law or agreed to in writing,
 * software distributed under the License is distributed on an
 * "AS IS" BASIS, WITHOUT WARRANTIES OR CONDITIONS OF ANY
 * KIND, either express or implied.  See the License for the
 * specific language governing permissions and limitations
 * under the License.
 */

(function(root, factory) {
    if (typeof define === 'function' && define.amd) {
        // AMD. Register as an anonymous module.
        define(['exports', 'echarts'], factory);
    } else if (typeof exports === 'object' && typeof exports.nodeName !== 'string') {
        // CommonJS
        factory(exports, require('echarts'));
    } else {
        // Browser globals
        factory({}, root.echarts);
    }
}(this, function(exports, echarts) {
    var log = function(msg) {
        if (typeof console !== 'undefined') {
            console && console.error && console.error(msg);
        }
    }
    if (!echarts) {
        log('ECharts is not Loaded');
        return;
    }
    if (!echarts.registerMap) {
        log('ECharts Map is not loaded')
        return;
    }
//注意,下面的内容要改成自己的
    echarts.registerMap('你选择的json文件的城市名字', "填入json文件里面的全部内容");
}));
?3、把第一个单引号的内容改成自己选择的城市,注意要一模一样,像我选择的是“惠州市”,就不能填“惠州”;第二个双引号要去掉,然后填入json文件里的所有内容,注意跟第一个引号不一样的是,这里的双引号要去掉

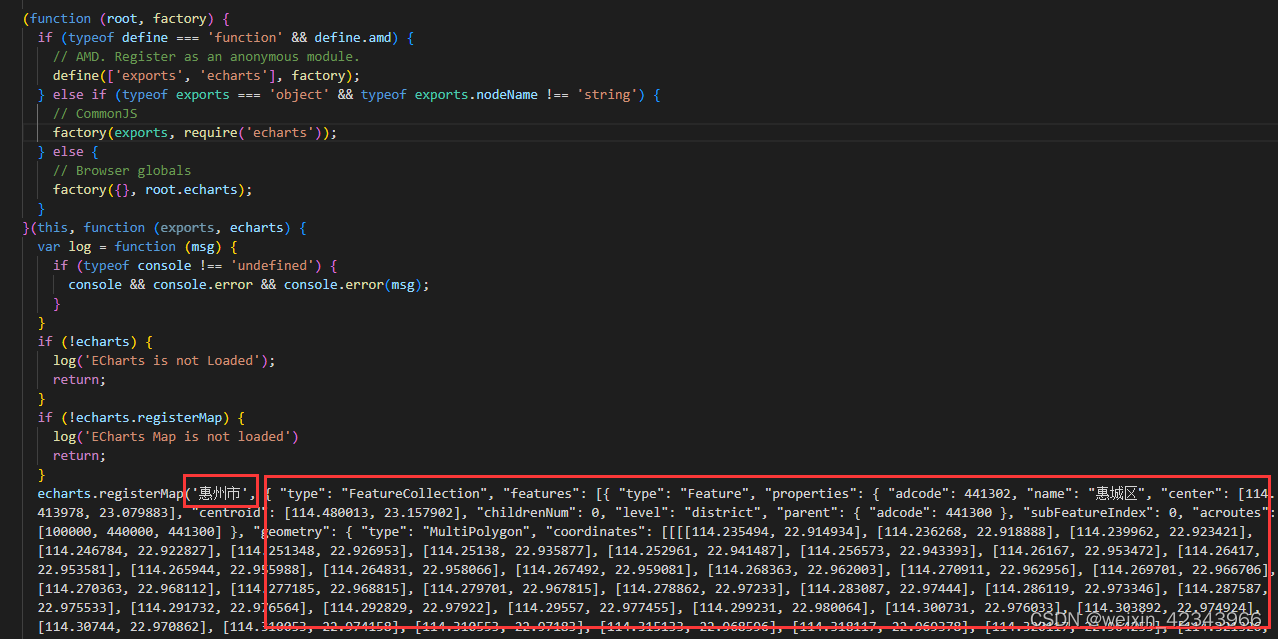
?三、代码实现
1.通过npm安装echarts(已经安装了的忽略这步)
npm install echarts --saveecharts官网地址Apache ECharts https://echarts.apache.org/zh/index.html
2、在页面引进echarts和城市js文件
?
?3、完整代码
<template>
  <div id="huizhou-map" ref="mapBox" style="backgroup-color:#ffffff;" />
</template>
<script>
import * as echarts from 'echarts'
import '@/assets/huizhou'
export default {
  data() {
    return {
      chart: null,
      options: {}
    }
  },
  created() {
    this.options = {
      tooltip: {
        trigger: 'item'
      },
      title: {
        text: '惠州地图',
        x: 'center'
      },
      geo: { // 地图的显示信息
        map: '惠州市',
        roam: true,
        itemStyle: {
          normal: {
            areaColor: '#0d0059',
            borderColor: '#389dff',
            borderWidth: 1, // 设置外层边框
            shadowBlur: 5, // 阴影模糊度
            shadowOffsetY: 8,
            shadowOffsetX: 0,
            shadowColor: '#01012a'
          },
          emphasis: { // 鼠标移上去的hover效果
            areaColor: '#184cff',
            shadowOffsetX: 0,
            shadowOffsetY: 0,
            shadowBlur: 5,
            borderWidth: 0,
            shadowColor: 'rgba(0, 0, 0, 0.5)'
          }
        }
      },
      series: [
        {
          map: '惠州市',
          type: 'map',
          aspectScale: 0.9,
          roam: false,
          label: {
            show: true,
            textStyle: {
              color: '#fff',
              fontSize: 12
            }
          },

          itemStyle: {
            normal: {
              areaColor: '#0d0059',
              borderColor: '#389dff',
              borderWidth: 0.5
            },
            emphasis: {
              areaColor: '#17008d',
              shadowOffsetX: 0,
              shadowOffsetY: 0,
              shadowBlur: 5,
              borderWidth: 0,
              shadowColor: 'rgba(0, 0, 0, 0.5)'
            }
          }
        }
      ]
    }
  },
  mounted() {
    this.chart = echarts.init(this.$refs.mapBox)
    this.chart.setOption(this.options)
  },
  beforeDestroy() {
    if (!this.chart) {
      return
    }
    this.chart.dispose()
    this.chart = null
  }
}
</script>
<style rel="stylesheet/scss" lang="scss" scoped>
  #huizhou-map{
    width: 800px;
    height: 800px;
    margin: 0 auto;
    background-color: #b6bad8;
}

</style>
四、实现效果图
