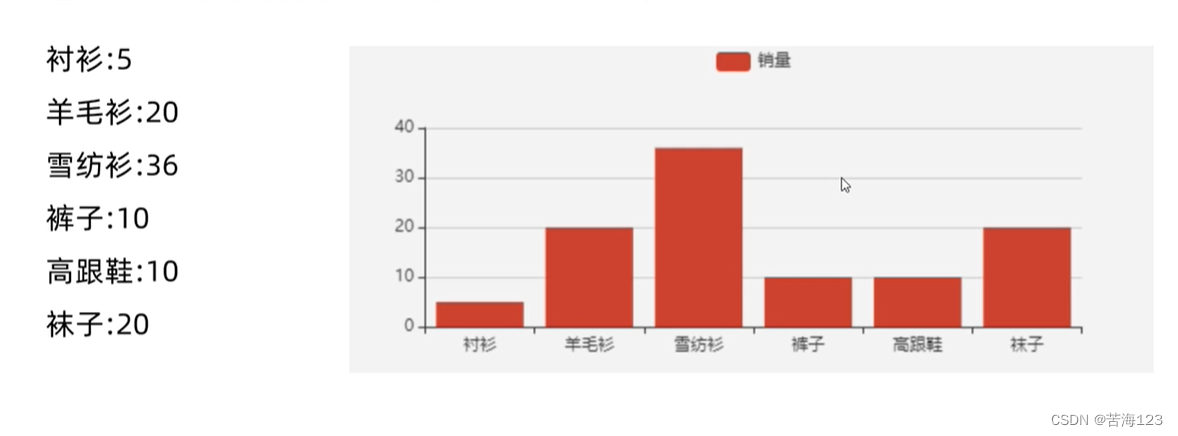
数据可视化概念:
把数据以图表的方式体现,更加直观可见,如下文字和图表对比:

数据可视化实现的方式:
报表类:Excel 、水晶报表等,面向非技术人员,点击图标即可生成图表,非常不灵活。
商业智能BI:Microsoft BI 、Power-BI等,也可以展示图表信息,并且可以自己做出决策,
编码类:Echarts.js、D3.js、Chart.js等,灵活性高,可视化度高,需要有编码经验的工程师才能开发。
echarts简介:
ECharts是一款基于JavaScript的数据可视化图表库,提供直观,生动,可交互,可个性化定制的数据可视化图表。ECharts最初由百度团队开源,兼容性极好,支持pc和移动等多端,开源免费,社区活跃,并于2018年初捐赠给Apache基金会,成为ASF孵化级项目;JavaScript数据可视化库有很多种,常用的如:D3.js、Recharts、Chart.js等,ECharts 其官网:https://echarts.apache.org/zh/index.html
多种数据格式支持:
key-value、二维表、typedarray格式
流数据的支持:支持加载多少数据,渲染多少数据。
增量渲染技术:变化的渲染数据,可以提高性能。

Echarts基本使用:
1.引入echarts.js文件:框架开发中支持模块化导入
2.准备一个呈现图表的容器(div):给上尺寸
3.初始化echarts实例对象:
4.准备配置项:
5.将配置项设置给echarts实例对象
原生js中使用:
<body>
  <!-- 1.引入echarts.js文件:,如果是在vue等框架的支持下,可以使用模块化引入 -->
  <script src="https://cdn.jsdelivr.net/npm/echarts@5.4.0/dist/echarts.min.js"></script>
  <!-- 2.准备一个呈现图表的容器(div): -->
  <div style="width: 600px;height:500px"></div>
  <script>
    // 3.初始化一个echarts实例对象:init方法中将容器传入:init第二个参数表示主题light/dark,默认light
    // 除了给init方法传入第二个参数修改主题外,还支持自定义主题,自定义主题修改方式:进入网址对自己的主题编辑后进行下载js代码:https://echarts.apache.org/zh/theme-builder.html,之后引入js代码,并将init第二个参数名称改为自己主题命名的自定义主题名称。
    const myChart = echarts.init(document.querySelector('div'),'dark')
    // 4.准备配置项:
    const options = {
      // 全局配置调色
      // color: ['pink', 'blue'],
      xAxis: {
        type: 'category',
        data: ['1月','2月','3月','4月','5月','6月','7月','8月','9月','10月','11月','12月']
      },
      yAxis: {
        type: 'value'
      },
      series: [
        {
          name: '服装销量',
          type: 'bar',
          data: [5, 7, 8, 20, 2, 7, 8, 15, 5, 12, 15, 18, 12],
          // 局部配置调色
          color: ['skyblue','#000000'],
          // 跟随数据显示不同的颜色,colorBy,itemStyle中color不能同时存在
          colorBy: 'data',
          itemStyle: {
            // 调色盘除配置单色外还可以配置渐变色
            color: {
              // 渐变类型:linear线性渐变/radial径向渐变
              type: 'linear',
              // 配置起始和结束位置
              x:0,
              y:0,
              // 如果是径向渐变,那么x2和y2用r代替即可
              x2:1,
              y2:1,
              // 配置颜色种类
              colorStops: [
                {
                  offset:0,
                  color:'skyblue'
                },
                {
                  offset:1,
                  color:'yellow'
                }
              ]
            }
          }
        },
        {
          name: '服装销量',
          type: 'line',
          data: [5, 7, 8, 20, 2, 7, 8, 15, 5, 12, 15, 18, 12]
        }
      ]
    }
    // 5.将配置项设置给echarts实例对象
    myChart.setOption(options)
  </script>
</body>
vue中使用:
<template>
  <!-- 主要盒子 -->
  <div style="width: 100%;height:100%">
    <!-- 2.准备一个呈现图表的容器(div) -->
    <div ref="alarm" style="width: 600px;height:500px"></div>
  </div>
</template>
<script>
// 1.导入echarts库,首先npm install echarts 下载库
import * as echarts from 'echarts'
export default {
  mounted () {
    // *2组件挂载后再调用方法,否则无法生成图表
    this.barEchartsHandle()
  },
  methods: {
    // *1创建一个方法用来生成图表
    barEchartsHandle () {
      // 3.初始化一个echarts实例对象:init方法中将容器传入:
      const myChart = echarts.init(this.$refs.alarm)
      // 4.准备配置项:
      const options = {
        xAxis: {
          type: 'category',
          data: ['1月','2月','3月','4月','5月','6月','7月','8月','9月','10月','11月','12月']
        },
        yAxis: {
          type: 'value'
        },
        series: [
          {
            name: '服装销量',
            type: 'bar',
            data: [5, 7, 8, 20, 2, 7, 8, 15, 5, 12, 15, 18, 12]
          },
          {
            name: '服装销量',
            type: 'line',
            data: [5, 7, 8, 20, 2, 7, 8, 15, 5, 12, 15, 18, 12]
          }
        ]
      }
      // 5.将配置项设置给echarts实例对象
      myChart.setOption(options)
    }
  }
}
</script>
 <style lang="less" scoped></style>
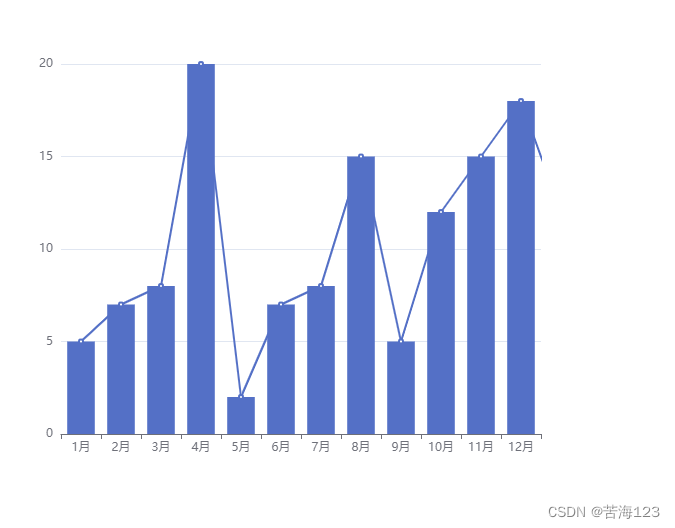
效果图:

echarts中配置项options
echarts中配置项options配置非常多,下面简单介绍常用配置项:
通用配置:这些通用配置会在下面Echarts中常用7大类图表中体现出,稍微注意就可以。
标题title(标题样式textStyle、标题宽度borderWidth、标题颜色borderColor、标题圆角borderRadius)
提示框tooltip,鼠标滑过会出现提示框,触发类型trigger(item/axis)、触发时机triggerOn(mousemove/click)、格式化formatter(可以接收字符串、模板字符串、有返回值的回调函数,模板变量时有特殊含义变量:系列名{a}、数据名{b}、数据值{c}、{d}、{e}、),属性较多,粘上官方文档:https://echarts.apache.org/zh/option.html#%2Fsearch%2Fformatter
工具按钮toolbox提供导出图片、重置试图、动态类型切换、数据区域缩放、数据试图五个工具
图例legend
样式:可以给某个item设置不同的样式,可分为:直接样式(itemStyle/textStyle/lineStyle/areaStyle/label)和高亮样式(在emphasis中包裹itemStyle/textStyle/lineStyle/areaStyle/label)
**重新熏染图表:**根据浏览器大小重新渲染图表大小,init的实例下有方法:resize()
加载动画:init的实例下有方法:showLoading()/hideLoading()
**私有配置:**不同的类型表有自己私有的配置属性,下面会有案例说明。
增量动画:如果要改变图表中的某些数据,还想要动画的方式体现,此时可以直接创建一个新的数据options配置对象,之后设置给原来的实例(setOption()),这里不会完全覆盖,它只会将不同的数据进行整合
Echarts中常用7大类图表:
1.柱状图:
// 配置项介绍:
    const options = {
      // 1.title:配置图表标题:
      title: {
        // text:标题文本
        text: '服装每月销售量',
        // link:配置标题超链接跳转
        link: 'http:www.baidu.com',
        // textStyle:配置标题样式:
        textStyle: {
          // color:配置标题颜色,还有部分常用属性:
          color: 'skyBlue'
        },
        // 标题边框宽度
        borderWidth: 2,
        // 标题边框颜色
        borderColor: 'yellow',
        // 标题边框圆角
        borderRadius: 5,
        // 标题距离左边距离,标题位置有4个属性,分别:left、top、bottom、right
        left: 30,
        // 标题距离顶部边距离
        top: 10
      },
      // 3.tooltip提示框
      tooltip: {
        // trigger触发类型:axis表示鼠标移动到轴就可以触发提示框,item表示鼠标移动到柱子上才会显示提示框
        // trigger: 'item',//主要在散点图,饼图等无类目轴的图表中使用
        trigger: 'axis',
        // triggerOn触发时机,默认mousemove表示鼠标滑过触发提示框显示,click表示点击时触发提示框显示
        triggerOn: 'mousemove',
        // formatter自定义提示框内容:直接写字符串会直接输出字符串,当为模板字符串时,会自动展示模板变量数据,多个series项时只显示第一个的数据,除非隐藏掉其他的后才会显示非第一个,模板变量规定规则:https://echarts.apache.org/zh/option.html#%2Fsearch%2Fformatter
        // formatter: `{b}的销量为:{c}`
        // formatter后面接函数时,函数参数为一个数组,每个数组元素表示一个item项,第一个元素表示鼠标经过的元素本身(当然数组中只有一个元素)
        formatter: (e) => {
          // console.log(e)
          return `<div style='background:skyblue;color:#fff;'>${e[0].name}的销量为:${e[0].data}</div>`
        }
      },
      // 4.toolbox工具框
      toolbox: {
        // feature需要开启的工具功能有:
        feature: {
          // 导出图片
          saveAsImage: {},
          // 数据视图
          dataView: {},
          // 重置
          restore: {},
          // 区域缩放
          dataZoom: {
            yAxisIndex: 'none'
          },
          // magicType启用的动态类型,包括'line'(切换为折线图), 'bar'(切换为柱状图), 'stack'(切换为堆叠模式,series有多个对象配置时生效)
          magicType: { type: ['line', 'bar','stack'] },
        }
      },
      // 3.xAxis:直角坐标系中X轴
      xAxis: {
        // type:轴类型:类目category、数值value;类目轴需要配置data轴数据,而value类型数据时series中data数据
        type: 'category',
        data: ['1月','2月','3月','4月','5月','6月','7月','8月','9月','10月','11月','12月']
      },
      //4. yAxis:直角坐标系中y轴
      yAxis: {
        type: 'value'
      },
      // 5.legend控制系列中某个对象显示或隐藏
      legend: {
        // data中的数组元素和series中对象的name保持一直
        data: ['服装销量','餐饮销量']
      },
      // 6.series:系列列表,里面每个对象将生成一种类型的图表,每种图表类型可根据实际情况选择不同的类型,但是要合理,如在直角坐标系中显示饼图就不太合理了
      series: [
        {
          // name:图表名称
          name: '服装销量',
          // type:图表类型名称,柱状图bar、折线图line、饼图pie
          type: 'bar',
          // 值数据:
          data: [5, 7, 8, 20, 2, 7, 8, 15, 5, 12, 15, 18, 12],
          // markPoint:配置标记点
          markPoint: {
            // data需要标记的元素
            data: [
              {
                // type:标记元素的类型
                type: 'max',
                // name:标记元素的名称
                name: '最大值'
              },
              {
                type: 'min',
                name: '最小值'
              }
            ]
          },
          // markLine配置标记线
          markLine: {
            data: [
              {
                type: 'average',
                name: '平均值'
              }
            ]
          },
          // label:配置显示详细数据
          label: {
            show: true,
            // rotate数值旋转显示
            rotate: 60,
            // position:配置数值位置,默认inside内部
            position: 'top'
          },
          // barWidth配置柱状图宽度
          barWidth: '20%'
        },
        {
          name: '餐饮销量',
          type: 'line',
          data: [15, 17, 18, 30, 12, 17, 18, 25, 15, 22, 15, 28, 22],
          markPoint: {
            data: [
              {
                type: 'max',
                name: '最大值'
              },
              {
                type: 'min',
                name: '最小值'
              }
            ]
          },
          markLine: {
            data: [
              {
                type: 'average',
                name: '平均值'
              }
            ]
          },
          label: {
            show: true,
            rotate: 0,
            position: 'top'
          }
        }
      ]
    }
2.折线图:
// 配置项介绍:
    const options = {
      // 1.title:配置图表标题:
      title: {
        // text:标题文本
        text: '服装每月销售量',
        // link:配置标题超链接跳转
        link: 'http:www.baidu.com',
        // textStyle:配置标题样式:
        textStyle: {
          // color:配置标题颜色,还有部分常用属性:
          color: 'skyBlue'
        },
        // 标题边框宽度
        borderWidth: 2,
        // 标题边框颜色
        borderColor: 'yellow',
        // 标题边框圆角
        borderRadius: 5,
        // 标题距离左边距离,标题位置有4个属性,分别:left、top、bottom、right
        left: 30,
        // 标题距离顶部边距离
        top: 10
      },
      // 3.tooltip提示框
      tooltip: {
        // trigger触发类型:axis表示鼠标移动到轴就可以触发提示框,item表示鼠标移动到柱子上才会显示提示框
        // trigger: 'item',//主要在散点图,饼图等无类目轴的图表中使用
        trigger: 'axis',
        // triggerOn触发时机,默认mousemove表示鼠标滑过触发提示框显示,click表示点击时触发提示框显示
        triggerOn: 'mousemove',
        // formatter自定义提示框内容:直接写字符串会直接输出字符串,当为模板字符串时,会自动展示模板变量数据,多个series项时只显示第一个的数据,除非隐藏掉其他的后才会显示非第一个,模板变量规定规则:https://echarts.apache.org/zh/option.html#%2Fsearch%2Fformatter
        // formatter: `{b}的销量为:{c}`
        // formatter后面接函数时,函数参数为一个数组,每个数组元素表示一个item项,第一个元素表示鼠标经过的元素本身(当然数组中只有一个元素)
        formatter: (e) => {
          // console.log(e)
          return `<div style='background:skyblue;color:#fff;'>${e[0].name}的销量为:${e[0].data}</div>`
        }
      },
      // 4.toolbox工具框
      toolbox: {
        // feature需要开启的工具功能有:
        feature: {
          // 导出图片
          saveAsImage: {},
          // 数据视图
          dataView: {},
          // 重置
          restore: {},
          // 区域缩放
          dataZoom: {
            yAxisIndex: 'none'
          },
          // magicType启用的动态类型,包括'line'(切换为折线图), 'bar'(切换为柱状图), 'stack'(切换为堆叠模式,series有多个对象配置时生效)
          magicType: { type: ['line', 'bar','stack'] },
        }
      },
      // 3.xAxis:直角坐标系中X轴
      xAxis: {
        // type:轴类型:类目category、数值value;类目轴需要配置data轴数据,而value类型数据时series中data数据
        type: 'category',
        data: ['1月','2月','3月','4月','5月','6月','7月','8月','9月','10月','11月','12月'],
        // 设置第一个点是否在y轴上,默认第一个点和y轴之间有距离
        boundaryGap: false
      },
      //4. yAxis:直角坐标系中y轴
      yAxis: {
        type: 'value',
        // 配置数值轴坐标值是否不从0开始计算
        scale: true
      },
      // 6.series:系列列表,里面每个对象将生成一种类型的图表
      series: [
        {
          // name:图表名称
          name: '服装销量',
          // type:图表类型名称,柱状图bar、折线图line、饼图pie
          type: 'line',
          // 值数据:
          data: [5, 6, 6, 5, 5, 6, 5, 5, 6, 5, 6, 5, 5],
          // markPoint:配置标记点
          markPoint: {
            // data需要标记的元素
            data: [
              {
                // type:标记元素的类型
                type: 'max',
                // name:标记元素的名称
                name: '最大值'
              },
              {
                type: 'min',
                name: '最小值'
              }
            ]
          },
          // markLine配置标记线
          markLine: {
            data: [
              {
                type: 'average',
                name: '平均值'
              }
            ]
          },
          // markArea配置标记区域
          markArea: {
            data: [
              [
                {xAxis: '1月'},
                {xAxis: '2月'}
              ],
              [
                {xAxis: '7月'},
                {xAxis: '9月'}
              ]
            ],
          },
          // label:配置显示详细数据
          label: {
            show: true,
            // rotate数值旋转显示
            rotate: 60,
            // position:配置数值位置,默认inside内部
            position: 'top'
          },
          // smooth设置拐角平滑过渡,默认折线图拐点是比较坚硬的角
          smooth: true,
          // lineStyle设置线条样式:
          lineStyle: {
            // 设置线条颜色
            color: 'yellow',
            // 设置线条样式,点线dotted,虚线dashed,默认solid实线
            type: 'dotted'
          },
          // 设置区域样式,线条下面区域的样式
          areaStyle: {
            // 填充颜色
            color: 'pink'
          }
        }
        // 图形堆加:当series下有多个对象且每个对象type为line,并且给每个对象设置相同的stack:'相同值',那么后面的直线图会在第一个的基础上增加值显示,而不是交错,注意,堆加会改变远数据数值,是在第一个的基础上增加的,设置areaStyle效果更明显
      ]
    }
3.散点图:折线图,柱状图散点图都在直角坐标系中,可以对直角坐标系进行配置(grid网格,axis坐标轴,dataZoom区域缩放),下面散点图中有关于直角坐标系配置说明:
// 配置项介绍:
    // 常见效果:气泡图(散点大小不同、颜色不同)、涟漪动画图,常用于地图
    const options = {
      // 筛选数据滑块
      dataZoom: [
        {
          // slider出现托动条,inside通过滚轮缩放
          type: 'slider',
          // xAxisIndex指明作用的轴为x轴,yAxisIndex指明作用的轴为y轴,一个对象两者选其一
          xAxisIndex: 0,
          // start和end指明起始和结束位置
          start: 20,
          end: 80
        }
      ],
      // 坐标系边框
      grid: {
        show: true,
        // 边框宽度
        borderWidth: 5,
        // 边框颜色
        borderColor: 'skyblue',
        // 可以设置边框的位置:left/top/bottom/right
        top: 100,
        // 尺寸:
        width: 400,
        height: 300
      },
      // 散点图的x轴和y轴的类型都为数值型
       xAxis: {
        type: 'value',
        scale: true,
        // position可以设置轴的显示位置,只能是对立的,如底部的话只能设置到顶部
        position: 'top'
      },
      yAxis: {
       type: 'value',
       scale: true
      },
     // scatter表示散点图,data为一个二维数组
     series: [
      {
        // type: 'scatter',
        // effectScatter设置涟漪效果
        type: 'effectScatter',
        // rippleEffect控制涟漪范围大小
        rippleEffect: {
          scale: 10
        },
        // showEffectOn控制涟漪动画出现的时机,render默认一加载就出现涟漪,emphasis鼠标移过去显示
        showEffectOn: 'render',
        data: [[1, 2], [2, 4], [3, 6], [4, 8],[7, 2], [7, 4], [8, 6], [1, 8]],
        // 设置点的大小,如果想要气泡效果,每个点的大小不能设置为一样的开可以,当后面接收一个函数并有返回值时可以设置点的大小
        // symbolSize: 20
        symbolSize: (e) => {
          // 函数参数e表示每一个一维数组中的数据
          let a = e[0]
          let b = e[1]
          if (a * b > 30) {
            return 20
          }
          return b * a
        },
        // itemStyle设置每个点的样式
        itemStyle: {
          // color: 'pink'//可以给字符串,但是这样颜色就是定值了,同样可以给个带有返回值的函数:
          color: (e) => {
            let a = e.data[0]
            let b = e.data[1]
            if (a * b > 20) {
              return 'yellow'
            }
            return 'blue'
          }
        }
      }
     ]
    }
4.饼图:
 // 配置项介绍:
    const options = {
      series: [
       {
        // 饼图只需要将type设置为pie,data数据为一个数组中包含多个对象,每个对象的键为name和value
        type: 'pie',
        // label伸出饼图主要部分的提示文字
        label: {
          // show控制显示或隐藏
          show: true,
          // formatter自定义提示文本
          formatter: (e) => {
            // console.log(e)
            return `在${e.name}消费${e.value}元,占比${e.percent}%`
          }
        },
        // radius设置圆弧半径,可以给数值,建议给百分比,如果给数组那么就会生成圆弧
        // radius: '50%',
        radius: ['50%', '80%'],
        roseType: 'radius',//南丁格尔玫瑰图,测试无效
        // itemStyle设置每段圆弧样式
        itemStyle: {
          borderRadius: 5
        },
        // selectedMode选中突出显示,偏离一小部分,single一个偏离,multiple多个偏离
        selectedMode: 'single',
        // selectedOffset设置偏离距离
        selectedOffset: 30,
        data: [
         {
           name: '京东',
           value: '5312'
         },
         {
           name: '淘宝',
           value: '2312'
         },
         {
           name: '唯品会',
           value: '1312'
         }
        ]
       }
      ]
    }
5.地图:
地图的使用方式有两种:第三方地图api如百度地图api、矢量地图
矢量图地图:
<!-- 需要引入china.js文件,chian.js文件需要自己在网上找 -->
<script src="./china.js"></script>
// 配置项介绍:
    const options = {
      geo: {
        type: "map",
        map: "china",
        // 允许缩放和拖动
        roam: true,
        // 显示地图省份名称
        label: {
          show: true
        },
        //每一块区域的样式
        itemStyle: {
          areaColor: 'green',
          borderColor: '#fff'
        },
        // 鼠标经过高亮显示
        emphasis: {
          itemStyle: {
            areaColor: "#31C6BC"
          }
        }
      },
      backgroundColor: "#071510",
      //地理坐标系组件。地理坐标系组件用于地图的绘制,支持在地理坐标系上绘制散点图,线集。
      series: [
        {
          type: "lines",
          coordinateSystem: "geo",
          zlevel: 5,
          // 箭头配置
          effect: {
            show: true,
            period: 5, //箭头指向速度,值越小速度越快
            trailLength: 0.7, //特效尾迹长度[0,1]值越大,尾迹越长重
            symbol: "triangle", //箭头图标
            symbolSize: 8, //图标大小
            color: "red", // 图标颜色
          },
          // 轨迹线
          lineStyle: {
            normal: {
              show: true,
              width: 0.5, //尾迹线条宽度
              opacity: 1, //尾迹线条透明度
              curveness: 0.3, //尾迹线条曲直度
              color: "#37F6E0", // 飞线颜色
            },
            color: "#37F6E0",
          },
          data: [
            // 配置多组轨迹
            {
              coords: [
                [103.823557, 36.058039], // 起点  甘肃
                [113.280637,23.125178] // 终点  广东
              ]
            },
            {
              coords: [
                [113.280637,23.125178], // 起点  广东
                [120.153576,30.287459] // 终点  浙江
              ]
            },
            {
              coords: [
                [120.153576,30.287459], // 起点  浙江
                [117.000923,36.675807], // 终点  山东
              ]
            },
            {
              coords: [
                [117.000923,36.675807], // 起点  山东
                [103.823557, 36.058039], // 终点  甘肃
              ]
            },
            {
              coords: [
                [103.823557, 36.058039], // 起点  甘肃
                [120.153576,30.287459], // 终点  浙江
              ]
            }
          ]
        },
        {
          type: "effectScatter",
          coordinateSystem: "geo",
          effectType: "ripple", //涟漪特效
          showEffectOn: "render",
          // 散点样式
          rippleEffect: {
            color: "#37F6E0",
            period: 2, // 涟漪特效的动画周期
            scale: 15, // 涟漪特效动画中波纹的最大缩放比例
            brushType: "fill", // 涟漪特效的波纹绘制方式
          },
          // 散点大小
          symbolSize: 2,
          hoverAnimation: true,
          // 涟漪标识中心点样式
          itemStyle: {
            color: 'rgba(255,255,255,.1)',
          },
          zlevel: 3,
          data: [
            { name: "甘肃", value: [103.823557, 36.058039] },
            {name: '广东',value: [113.280637,23.125178]},
            {name: '山东',value: [117.000923,36.675807]},
            {name: '浙江',value: [120.153576,30.287459]}
          ]
        }
      ]
    }
百度api地图实现:详细可参考开发文档:https://lbsyun.baidu.com/index.php?title=jspopular
<!DOCTYPE html>
<html>
<head>
	<title>设置地图3D视角</title>
</head>
<body>
  <script src="https://api.map.baidu.com/api?v=1.0&&type=webgl&ak=pgDPmxNXENGjQG9fv5S2DnTu3QpOTXOw"></script>
	<div id="allmap" style="height:800px;width:1000px;"></div>
  <script>
    // 创建Map实例
    var map = new BMapGL.Map("allmap")
     // 初始化地图,设置中心点坐标和地图级别
    map.centerAndZoom(new BMapGL.Point(116.280190, 40.049191), 19)
    //开启鼠标滚轮缩放
    map.enableScrollWheelZoom(true)
    map.setHeading(64.5)
    map.setTilt(73)
  </script>
</body>
</html>
6.雷达图:
  // 配置项介绍:
    const options = {
      radar: {
        // 配置每个节点的最大值
        indicator: [
          {
            name: '收入',
            max: 100
          },
          {
            name: '支出',
            max: 100
          },
          {
            name: '负债',
            max: 100
          },
          {
            name: '经验',
            max: 100
          },
          {
            name: '存款',
            max: 100
          }
        ],
        // 配置雷达图最外层显示图形:默认多边形polygon
        shape: 'circle'
      },
      series: [
        {
          // 雷达图类型
          type: 'radar',
          // 显示数值
          label: {
            show: true
          },
          // 配置阴影面积填充
          areaStyle: {},
          data: [
            {
              name: '小明',
              value: [20, 50, 100, 20, 30]
            },
            {
              name: '小红',
              value: [60, 20, 10, 100, 20]
            }
          ]
        }
      ]
    }
7.仪表盘图:
// 配置项介绍:
    const options = {
      series: [
        {
          // 仪表盘类型
          type: 'gauge',
          data: [
            // 每个对象代表一个指针
            {
              // 配置指针数值
              value: 220,
              // 配置指针样式
              itemStyle: {
                color: 'red'
              }
            },
            {value: 98}
          ],
          // 配置仪表盘数值范围
          max: 240,
          min: 0
        }
      ]
    }
提示:本文图片等素材来源于网络,若有侵权,请发邮件至邮箱:810665436@qq.com联系笔者 删除。
笔者:苦海