一、报错
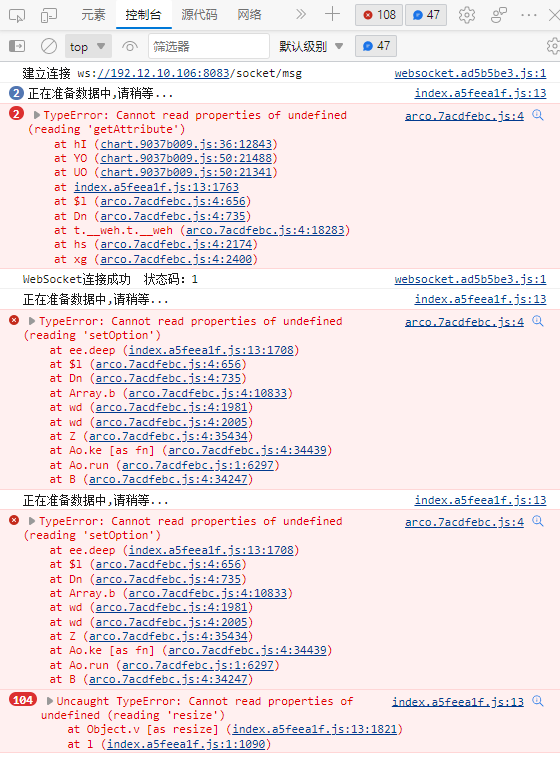
vue3+TS+Arco项目打包之后nginx部署之后Echarts折线图无法正常展示,报错信息如下
二、分析
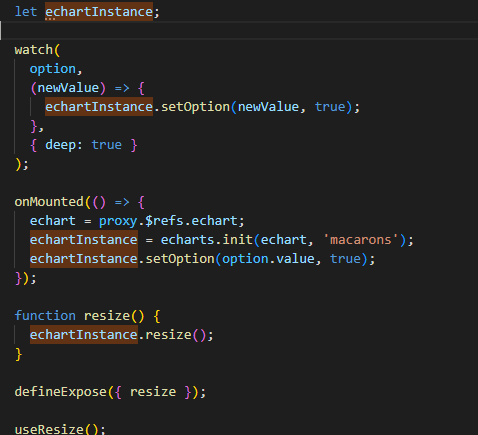
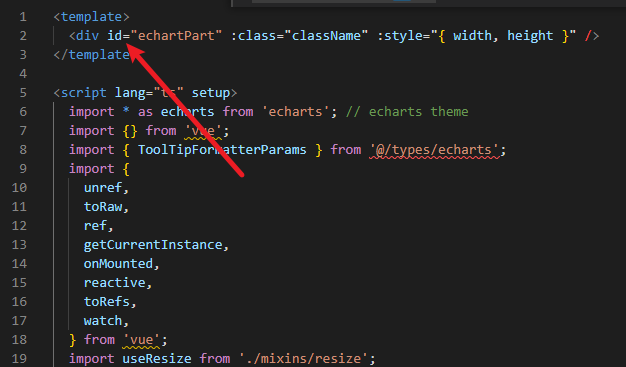
原因是在定义div时,使用了vue2中的$refs语法,渲染dom进行绘制echarts时,拿到dom元素之后无法进行 init 初始化,因此 Cannot read properties of undefined(reading 'setOption')报错。
三、解决
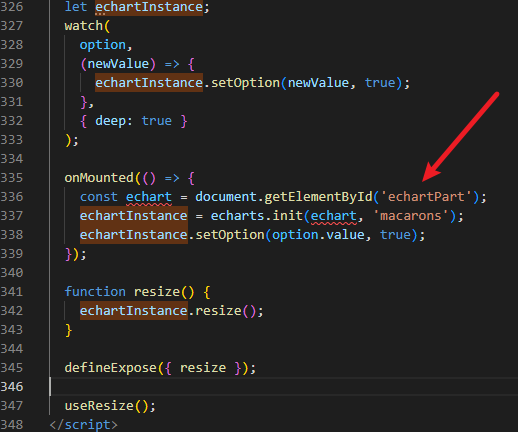
1、解决方式一,不建议使用
在取dom元素进行渲染时,使用原生的 document.getElwmwntById进行拿取 dom 元素,之后就可正常对echart 进行 init 初始化
2、解决方式二,建议使用
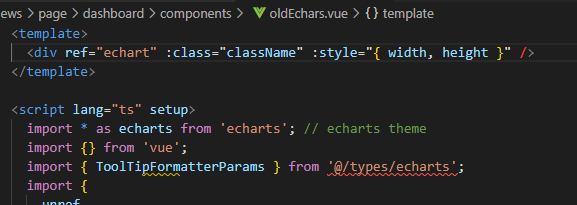
- 使用ref获取div
- 定义
const echart = ref(); - 在onmounted中进行init:
echarts.init(echart.value, 'macarons'); - 使用nextTick进行异步绘制数据
<template>
  <div ref="echart" :class="className" :style="{ width, height }" />
</template>

<script lang="ts" setup>
  import * as echarts from 'echarts'; // echarts theme
  import {
    unref,
    toRaw,
    ref,
    getCurrentInstance,
    onMounted,
    reactive,
    toRefs,
    watch,
    nextTick,
  } from 'vue';
  import useResize from './mixins/resize';

  const { proxy } = getCurrentInstance();
  const echart = ref();
  const echartInstance = ref();
  const props = defineProps({
    // 底图数据 chartData
    chartData: {
      type: Array,
      require: true,
      default: () => [],
    },
    // 真实数据 realData
    realData: {
      type: Array,
      require: true,
      default: () => [
        'A',
        [
          [100, 200],
          [280, 200],
        ],
      ],
    },
    width: {
      type: String,
      default: '100%',
    },
    height: {
      type: String,
      default: '500px',
    },
    className: {
      type: String,
      default: 'chart',
    },
    autoResize: {
      type: Boolean,
      default: true,
    },
  });

  const { chartData, realData } = toRefs(props);

  const data = reactive({
    option: {
      title: {
        text: '',
        left: 'center',
        top: 0,
        textStyle: {
          color: '#409eff',
          fontSize: '16',
          fontWeight: 'bold',
        },
      },
      grid: {
        left: '50',
        right: '20',
        top: '20',
        bottom: '100',
      },
      legend: {
        bottom: 0,
        icon: 'circle',
        textStyle: {
          color: 'white',
        },
      },
      xAxis: {
        type: 'time',
        scale: true,
        boundaryGap: false,
        axisLine: {
          lineStyle: {
            color: '#42ffff',
          },
        },
        axisTick: {
          show: true,
          alignWithLabel: true,
          lineStyle: {
            color: '#86909C',
          },
          interval(idx: number) {
            if (idx === 0) return false;
            if (idx === 5 - 1) return false;
            return true;
          },
        },
        axisLabel: {
          color: 'white',
          interval: 0.1,
          formatter(value: number, idx: number) {
            return `${value}秒`;
          },
        },
      },
      yAxis: {
        type: 'value',
        axisLabel: {
          color: 'white',
          margin: 12,
          formatter(value: number, idx: number) {
            if (chartData[0] === 'R') {
              if (value >= 10000 && value < 10000000) {
                return `${value / 10000}万千米`;
              }
              if (value >= 10000000) {
                return `${value / 10000000}千万米`;
              }
              return `${value}米`;
            }
            if (chartData[0] === 'A' || chartData[0] === 'E') {
              return `${value}度`;
            }
          },
        },
        splitLine: {
          lineStyle: {
            color: '#42ffff',
          },
        },
      },
      // tooltip: {
      //   trigger: 'axis',
      //   axisPointer: {
      //     type: 'cross',
      //     crossStyle: {
      //       color: '#999',
      //     },
      //   },
      // },
      tooltip: {
        show: true,
        trigger: 'axis',
        formatter (params) {
          console.log(12123);

          console.log(params[0]);

        },
      },
      series: [
        {
          name: '实际曲线',
          data: [],
          type: 'line',
          smooth: true,
          showSymbol: false,
          color: '#f76965',
          symbol: 'circle',
          symbolSize: 10,
          emphasis: {
            focus: 'series',
            itemStyle: {
              borderWidth: 2,
              borderColor: '#E0E3FF',
            },
          },
        },
        {
          name: '底线',
          data: [],
          type: 'line',
          smooth: true,
          showSymbol: false,
          color: '#93f576',
          symbol: 'circle',
          symbolSize: 10,
          emphasis: {
            focus: 'series',
            itemStyle: {
              borderWidth: 2,
              borderColor: '#D9F6FF',
            },
          },
        },
      ],
      dataZoom: [
        {
          bottom: 40,
          type: 'slider',
          left: 30,
          right: 14,
          height: 14,
          borderColor: 'transparent',
          handleSize: '20',
          textStyle: {
            color: 'rgba(0,0,0,0)',
          },
          handleStyle: {
            shadowColor: 'rgba(0, 0, 0, 0.2)',
            shadowBlur: 4,
          },
          brushSelect: false,
          backgroundColor: '#F2F3F5',
          textStyle: {
            color: 'rgba(4,28,52,0)',
          },
        },
        {
          type: 'inside',
          start: 0,
          end: 100,
          zoomOnMouseWheel: 'ctrl',
        },
      ],
    },
  });
  const { option } = toRefs(data);
  const num = ref(100); // 设置判定横坐标渲染的初始值
  const tempValue = ref(); // 设置 realData 的最后一项
  const realDataLength = ref(0); // 初始化 realData 的数据长度
  watch(
    realData,
    (newValue) => {
      let Tempreal = newValue[1];
      // console.log('before', Tempreal.length);
      console.log('正在准备数据中,请稍等...');

      if (Tempreal.length === 0) {
        Tempreal = {
          a: [
            [180, 200],
            [280, 300],
          ],
          e: [
            [180, 200],
            [280, 300],
          ],
        };
      } else {
        console.log('数据准备完成,已渲染...');
      }

      let tempY = [];
      tempY = Tempreal;
      if (newValue[0] === 'A') {
        if (Tempreal) {
          tempY = Tempreal.a;
          if (tempY) {
            realDataLength.value = tempY.length - 1;
            tempValue.value = tempY[realDataLength.value][0];
          }
        }
      } else if (newValue[0] === 'E') {
        if (Tempreal) {
          tempY = Tempreal.e;
          if (tempY) {
            realDataLength.value = tempY.length - 1;
            tempValue.value = tempY[realDataLength.value][0];
          }
        }
      }

      option.value.series[0].data = tempY;

      if (tempValue.value / 100 <= 1) {
        if (tempValue.value % 100 >= 80) {
          num.value = 200;
        } else {
          num.value = 100;
        }
      } else if (tempValue.value % 100 >= 80) {
        num.value = (parseInt(tempValue.value / 100) + 2) * 100;
      } else {
        num.value = (parseInt(tempValue.value / 100) + 1) * 100;
      }

      // BEGIN_绘制底图数据;
      if (
        props.chartData[0] === 'A' &&
        props.chartData[1] &&
        props.chartData[1].a
      ) {
        option.value.title.text = 'A';
        option.value.series[1].data = toRaw(
          unref(props.chartData[1].a.slice(0, num.value))
        );
      }
      if (
        props.chartData[0] === 'E' &&
        props.chartData[1] &&
        props.chartData[1].e
      ) {
        option.value.title.text = 'E';
        option.value.series[1].data = toRaw(
          unref(props.chartData[1].e.slice(0, num.value))
        );
      }
      // END_绘制底图数据
    },
    { deep: true, immediate: true }
  );

  watch(
    option,
    (newValue) => {
      echartInstance.value.setOption(newValue, true);
    },
    { deep: true }
  );

  onMounted(() => {
    echartInstance.value = echarts.init(echart.value, 'macarons');

    nextTick(() => {
      echartInstance.value.setOption(option.value, true);
    });
  });

  function resize() {
    echartInstance.value.resize();
  }

  defineExpose({ resize });

  useResize();
</script>

<style>
  .empty-block {
    position: absolute;
    top: 42%;
    left: 45%;
  }
</style>
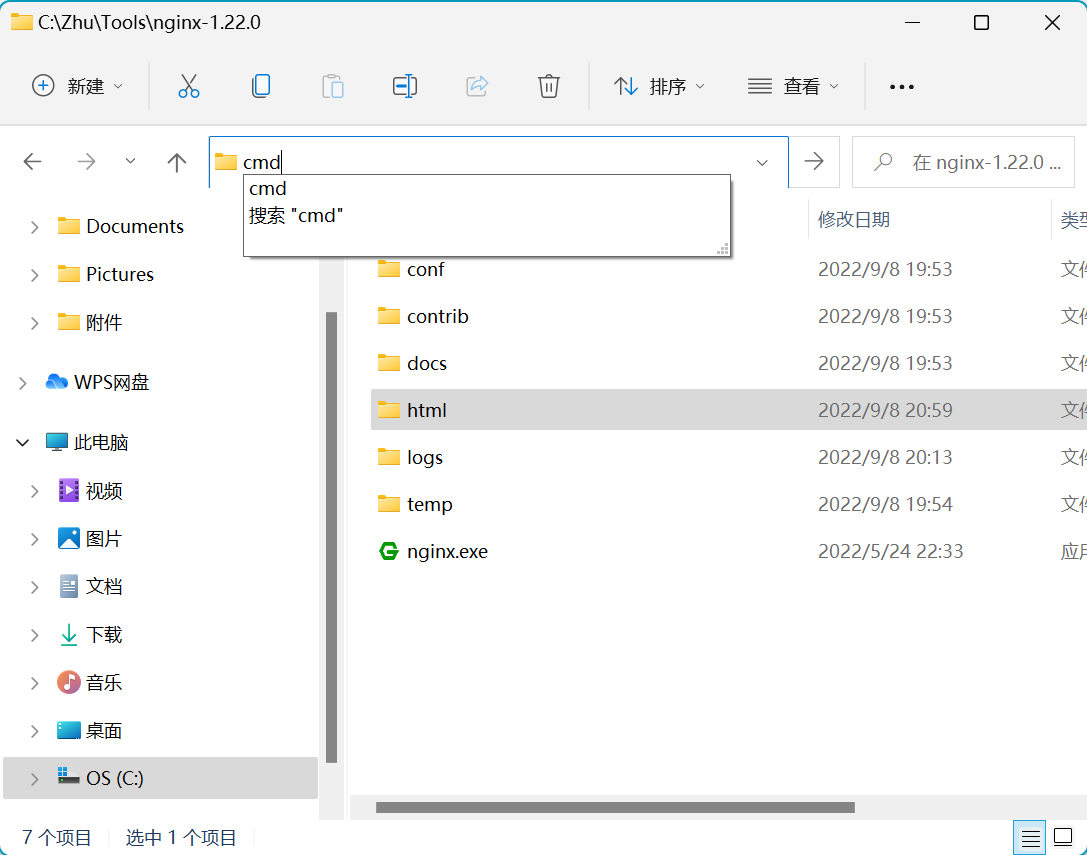
四、小Tips
输入 cmd 进入命令行窗口