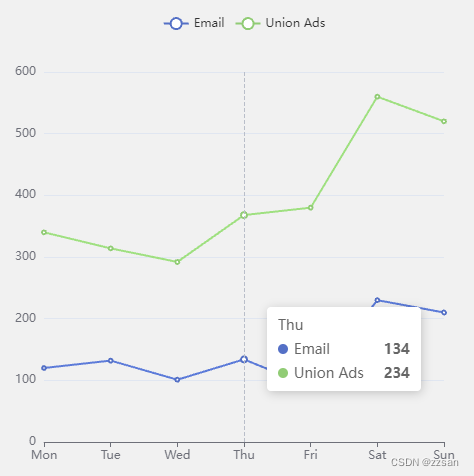
问题
使用vue3+echarts画统计图时, 图能正常显示, 但配置的tooltip不显示
代码
<template>
  <div ref="chartDom" class="chartDom">
  </div>
</template>

<script setup>
import * as echarts from 'echarts'
import { ref, onMounted, watch } from 'vue'
const chartDom = ref()

const option = {
  tooltip: {
    trigger: 'axis'
  },
  legend: {
    data: ['Email', 'Union Ads']
  },
  xAxis: {
    type: 'category',
    boundaryGap: false,
    data: ['Mon', 'Tue', 'Wed', 'Thu', 'Fri', 'Sat', 'Sun']
  },
  yAxis: {
    type: 'value'
  },
  series: [
    {
      name: 'Email',
      type: 'line',
      stack: 'Total',
      data: [120, 132, 101, 134, 90, 230, 210]
    },
    {
      name: 'Union Ads',
      type: 'line',
      stack: 'Total',
      data: [220, 182, 191, 234, 290, 330, 310]
    }
  ]
}
const chart = ref()

onMounted(() => {
  chart.value = echarts.init(chartDom.value)
  chart.value.setOption(option)
})
</script>

<style>
.chartDom{
  height: 500px;
  width: 500px;
}
</style>

鼠标悬浮, tooltip不显示
解决方案
原因: echarts实例赋值给ref响应式Proxy对象,导致tooltip不显示
解决办法:echarts实例赋值给普通变量
<template>
  <div ref="chartDom" class="chartDom">
  </div>
</template>

<script setup>
import * as echarts from 'echarts'
import { ref, onMounted, watch } from 'vue'
const chartDom = ref()

const option = {
  tooltip: {
    trigger: 'axis'
  },
  legend: {
    data: ['Email', 'Union Ads']
  },
  xAxis: {
    type: 'category',
    boundaryGap: false,
    data: ['Mon', 'Tue', 'Wed', 'Thu', 'Fri', 'Sat', 'Sun']
  },
  yAxis: {
    type: 'value'
  },
  series: [
    {
      name: 'Email',
      type: 'line',
      stack: 'Total',
      data: [120, 132, 101, 134, 90, 230, 210]
    },
    {
      name: 'Union Ads',
      type: 'line',
      stack: 'Total',
      data: [220, 182, 191, 234, 290, 330, 310]
    }
  ]
}
// 不赋值给ref响应式Proxy对象
let chart

onMounted(() => {
  chart = echarts.init(chartDom.value)
  chart.setOption(option)
})
</script>

<style scoped lang='scss'>
.chartDom{
  height: 500px;
  width: 500px;
}
</style>
