现在我们继续来进行后台主控台的开发和交互
首先是统计面板组件的开发:
首先需要拿到数据,就从提供的接口拿:
在api文件夹下创建一个index.js
import axios from '~/axios'

// 主控面板第一行数据接口
export function getStatistics1(){
    return axios.get("/admin/statistics1")
}
然后再编辑Index.vue
<template>
    <div>
        <el-row :gutter="20">
            <!-- 每块6个 -->
            <el-col :span="6" :offset="0" v-for="(item, index) in panels" :key="index">
                <!-- 卡片组件 -->
                <!-- 去掉边框 -->
                <el-card shadow="hover" class="border-0">
                    <template #header>
                        <!-- 利用flex布局的左右布局justify-between -->
                        <div class="flex justify-between">
                            <!-- 字体大小改为text-sm -->
                            <span class="text-sm">{{ item.title }}</span>
                            <!-- 后端返回回来的颜色值是unitColor -->
                            <el-tag :type="item.unitColor" effect="plain">
                                <!-- 后端返回的值(年) -->
                                {{ item.unit }}
                            </el-tag>
                        </div>
                    </template>
                    <!-- card body -->
                    <!-- 加大字体,加粗,灰色 -->
                    <span class="text-3xl font-bold text-gray-500">
                    	<!-- 数值 -->
                        {{ item.value }}
                    </span>

                    <!-- 分割线 -->
                    <el-divider />
                    <!-- 字体缩小,灰色 -->
                    <div class="flex justify-between text-sm text-gray-500">
                        <span>{{ item.subTitle }}</span>
                        <span>{{ item.subValue }}</span>
                    </div>
                </el-card>

            </el-col>
        </el-row>
    </div>
</template>
<!-- 响应式api ,ref,一个变量响应式,普通类型,script里面count.value,template里面直接{{count}}-->
<!-- 响应式api , reactive,用于对象 script里面form.count++,template里面直接{{form.count}}-->

<script setup>
import { ref } from 'vue'
import { getStatistics1 } from "~/api/index.js"

// 接收四个面板数据
const panels = ref([])
// 请求拦截器已经统一传了token,不用传多于参数
getStatistics1()
    .then(res => {
        panels.value = res.panels
        // 拿到了四个面板的数据
        // console.log(res)
        // console.log(panels.value)
    })
</script>
主要是用到了卡片组件以及layout布局,因为element plus提供的layout布局默认是占24格,而我们第一层数据面板有四条数据,所以我们就是每一块占6个,所以<el-col :span="6" :offset="0" v-for="(item, index) in panels" :key="index">里面的:span里面的值是6.看看效果:
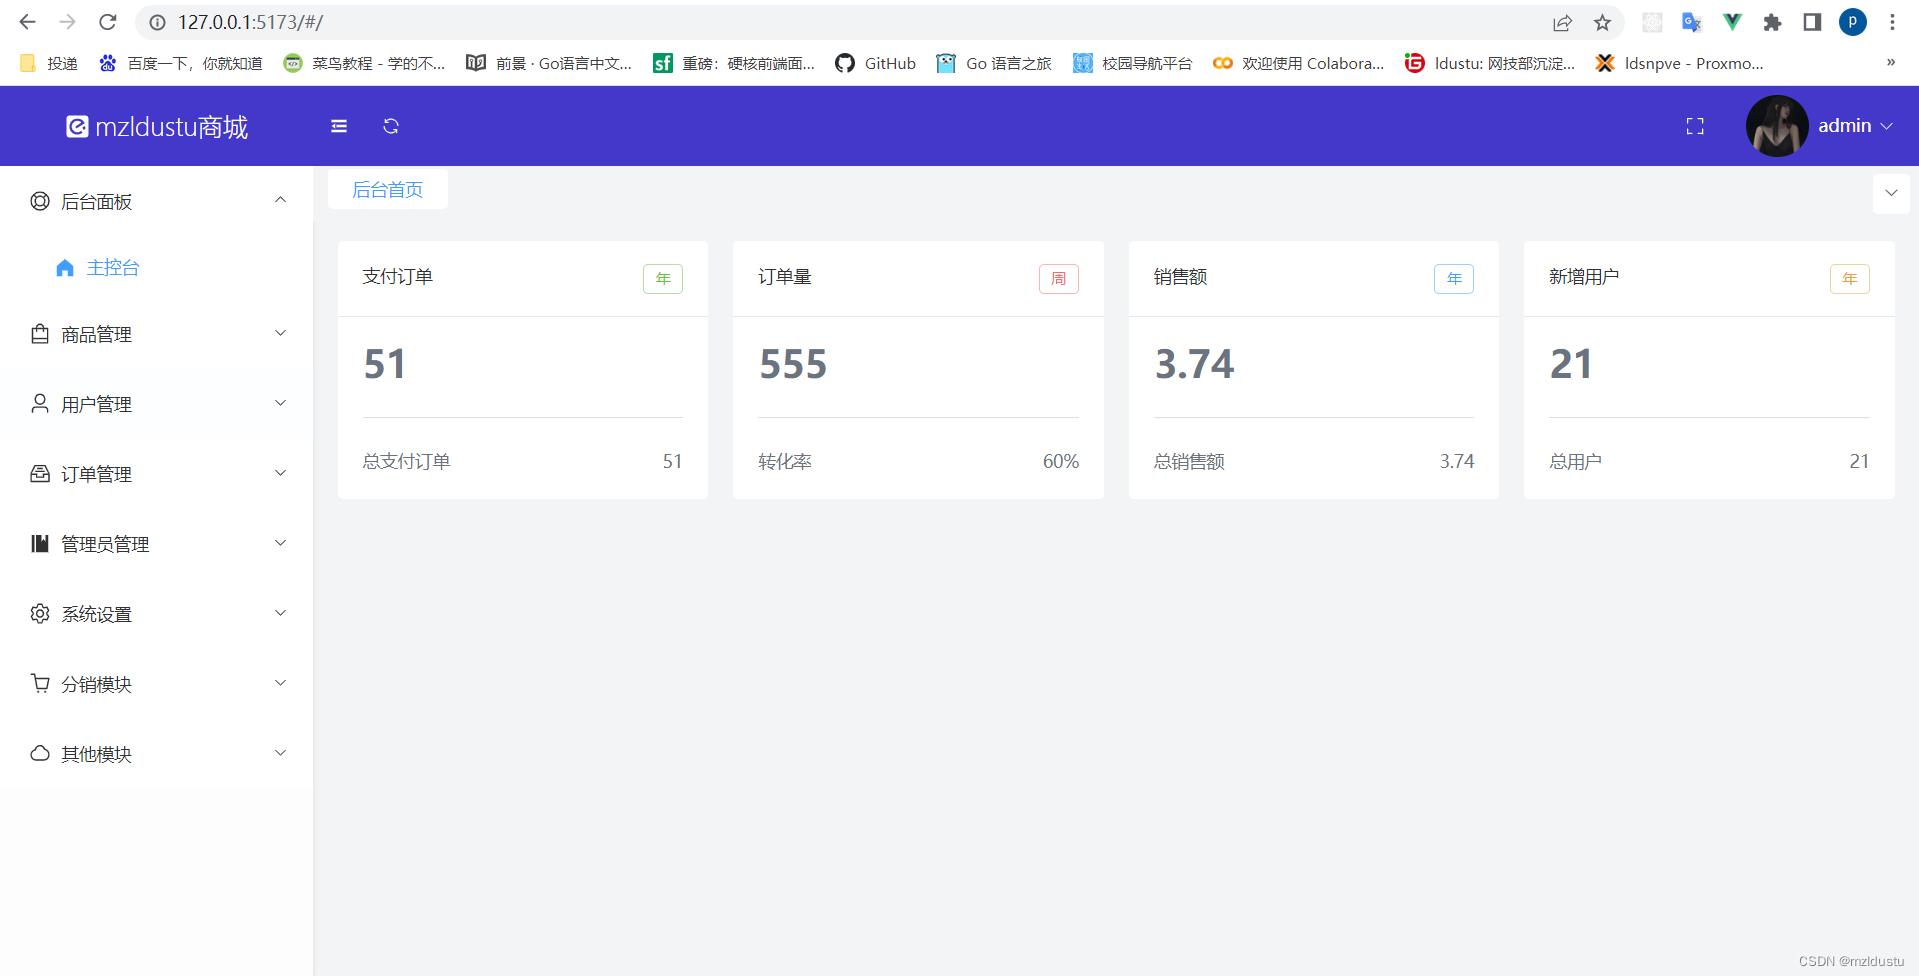
拿到了数据。
然后我们利用骨架屏优化体验:
这里我们要用到element提供给我们的一个骨架屏组件:
skeleton骨架屏
在index.vue里面加上骨架屏:
<template>
    <div>
        <el-row :gutter="20">
            <!-- 只有当内容全部为0的时候,才显示骨架屏 -->
            <template v-if="panels.length == 0">
                <!-- 骨架屏 -->
                <el-col :span="6" v-for="i in 4" :key="i">
                    <el-skeleton style="width:100%;" animated loading>
                        <template #template>
                            <!-- 卡片组件 -->
                            <!-- 去掉边框 -->
                            <el-card shadow="hover" class="border-0">
                                <template #header>
                                    <!-- 利用flex布局的左右布局justify-between -->
                                    <div class="flex justify-between">
                                        <!-- 字体大小改为text-sm -->
                                        <el-skeleton-item variant="text" style="width: 50%" />
                                        <!-- 后端返回回来的颜色值是unitColor -->
                                        <el-skeleton-item variant="text" style="width: 10%" />
                                    </div>
                                </template>
                                <!-- card body -->
                                <!-- 加大字体,加粗,灰色 -->
                                <el-skeleton-item variant="h3" style="width: 80%" />

                                <!-- 分割线 -->
                                <el-divider />
                                <!-- 字体缩小,灰色 -->
                                <div class="flex justify-between text-sm text-gray-500">
                                    <el-skeleton-item variant="text" style="width: 50%" />
                                    <el-skeleton-item variant="text" style="width: 10%" />
                                </div>
                            </el-card>
                            <el-skeleton-item variant="text" style="width: 30%" />
                        </template>
                    </el-skeleton>
                </el-col>
            </template>

            <!-- 内容区域 -->
            <!-- 每块6个 -->
            <el-col :span="6" :offset="0" v-for="(item, index) in panels" :key="index">
                <!-- 卡片组件 -->
                <!-- 去掉边框 -->
                <el-card shadow="hover" class="border-0">
                    <template #header>
                        <!-- 利用flex布局的左右布局justify-between -->
                        <div class="flex justify-between">
                            <!-- 字体大小改为text-sm -->
                            <span class="text-sm">{{ item.title }}</span>
                            <!-- 后端返回回来的颜色值是unitColor -->
                            <el-tag :type="item.unitColor" effect="plain">
                                <!-- 后端返回的值(年) -->
                                {{ item.unit }}
                            </el-tag>
                        </div>
                    </template>
                    <!-- card body -->
                    <!-- 加大字体,加粗,灰色 -->
                    <span class="text-3xl font-bold text-gray-500">
                        <!-- 数值 -->
                        {{ item.value }}
                    </span>

                    <!-- 分割线 -->
                    <el-divider />
                    <!-- 字体缩小,灰色 -->
                    <div class="flex justify-between text-sm text-gray-500">
                        <span>{{ item.subTitle }}</span>
                        <span>{{ item.subValue }}</span>
                    </div>
                </el-card>
            </el-col>
        </el-row>
    </div>
</template>
<!-- 响应式api ,ref,一个变量响应式,普通类型,script里面count.value,template里面直接{{count}}-->
<!-- 响应式api , reactive,用于对象 script里面form.count++,template里面直接{{form.count}}-->

<script setup>
import { ref } from 'vue'
import { getStatistics1 } from "~/api/index.js"

// 接收四个面板数据
const panels = ref([])
// 请求拦截器已经统一传了token,不用传多于参数
getStatistics1()
    .then(res => {
        panels.value = res.panels
        // 拿到了四个面板的数据
        // console.log(res)
        // console.log(panels.value)
    })
</script>
于是现在当面板数据没加载出来的时候会显示骨架屏,即loading效果。
接着来进行数字滚动动画的实现:
要用到gsap的第三方库,
npm i gsap
单独封装这个,在component文件夹下新建一个CountTo.vue
<template>
    {{ d.num.toFixed(0) }}
</template>

<script setup>
import gsap from 'gsap'
import { reactive, watch } from 'vue'

// props.value就是我们希望它滚动到的一个终点
// defineProps用于组件通信中父级组件给子级组件传值
const props = defineProps({
    value:{
        type:Number,
        default: 0
    }
})

// 初始为0
const d = reactive({
    num:0
})

function AnimateToValue(){
    gsap.to(d,{
        // 动画时长
        duration:0.5,
        // 最终等于传过来的数值
        num:props.value
    })
}

AnimateToValue()

// 防止setup执行完之后才修改value的值,所以给它监听一下
// 监听值的变化,如果值变化了就再调用AnimateToValue()方法
watch(()=>props.value,()=>AnimateToValue())
</script>
然后在index.vue导入

然后在原本{{ item.value }}的地方用CountTou子组件替换一下:

然后我们继续来进行分类组件的开发和跳转:
在components文件夹下面创建indexNavs.vue
<template>
    <!-- 距离上面有个外间距 -->
    <el-row :gutter="20" class="mt-5">
        <el-col :span="3" :offset="0" v-for="(item,index) in iconNavs" :key="index">
        <!-- 卡片组件 -->
            <el-card shadow="hover" @click="$router.push(item.path)">
                <div class="flex flex-col items-center justify-center cursor-pointer">
                    <el-icon size="16" :class="item.color">
                        <!-- 动态组件 -->
                        <component :is="item.icon"></component>
                    </el-icon>
                    <span class="text-sm mt-2">{{ item.title }}</span>
                </div>
            </el-card>
        </el-col>
    </el-row>
</template>

<script setup>

const iconNavs = [
        {
            icon:"user",
            color:"text-light-blue-500",
            title:"用户",
            path:"/user/list"
        },
        {
            icon:"shopping-cart",
            color:"text-violet-500",
            title:"商品",
            path:"/goods/list"
        },
        {
            icon:"tickets",
            color:"text-fuchsia-500",
            title:"订单",
            path:"/order/list"
        },
        {
            icon:"chat-dot-square",
            color:"text-teal-500",
            title:"评价",
            path:"/comment/list"
        },
        {
            icon:"picture",
            color:"text-rose-500",
            title:"图库",
            path:"/image/list"
        },
        {
            icon:"bell",
            color:"text-green-500",
            title:"公告",
            path:"/notice/list"
        },
        {
            icon:"set-up",
            color:"text-grey-500",
            title:"配置",
            path:"/setting/base"
        },
        {
            icon:"files",
            color:"text-yellow-500",
            title:"优惠券",
            path:"/coupon/list"
        }
    ]
</script>
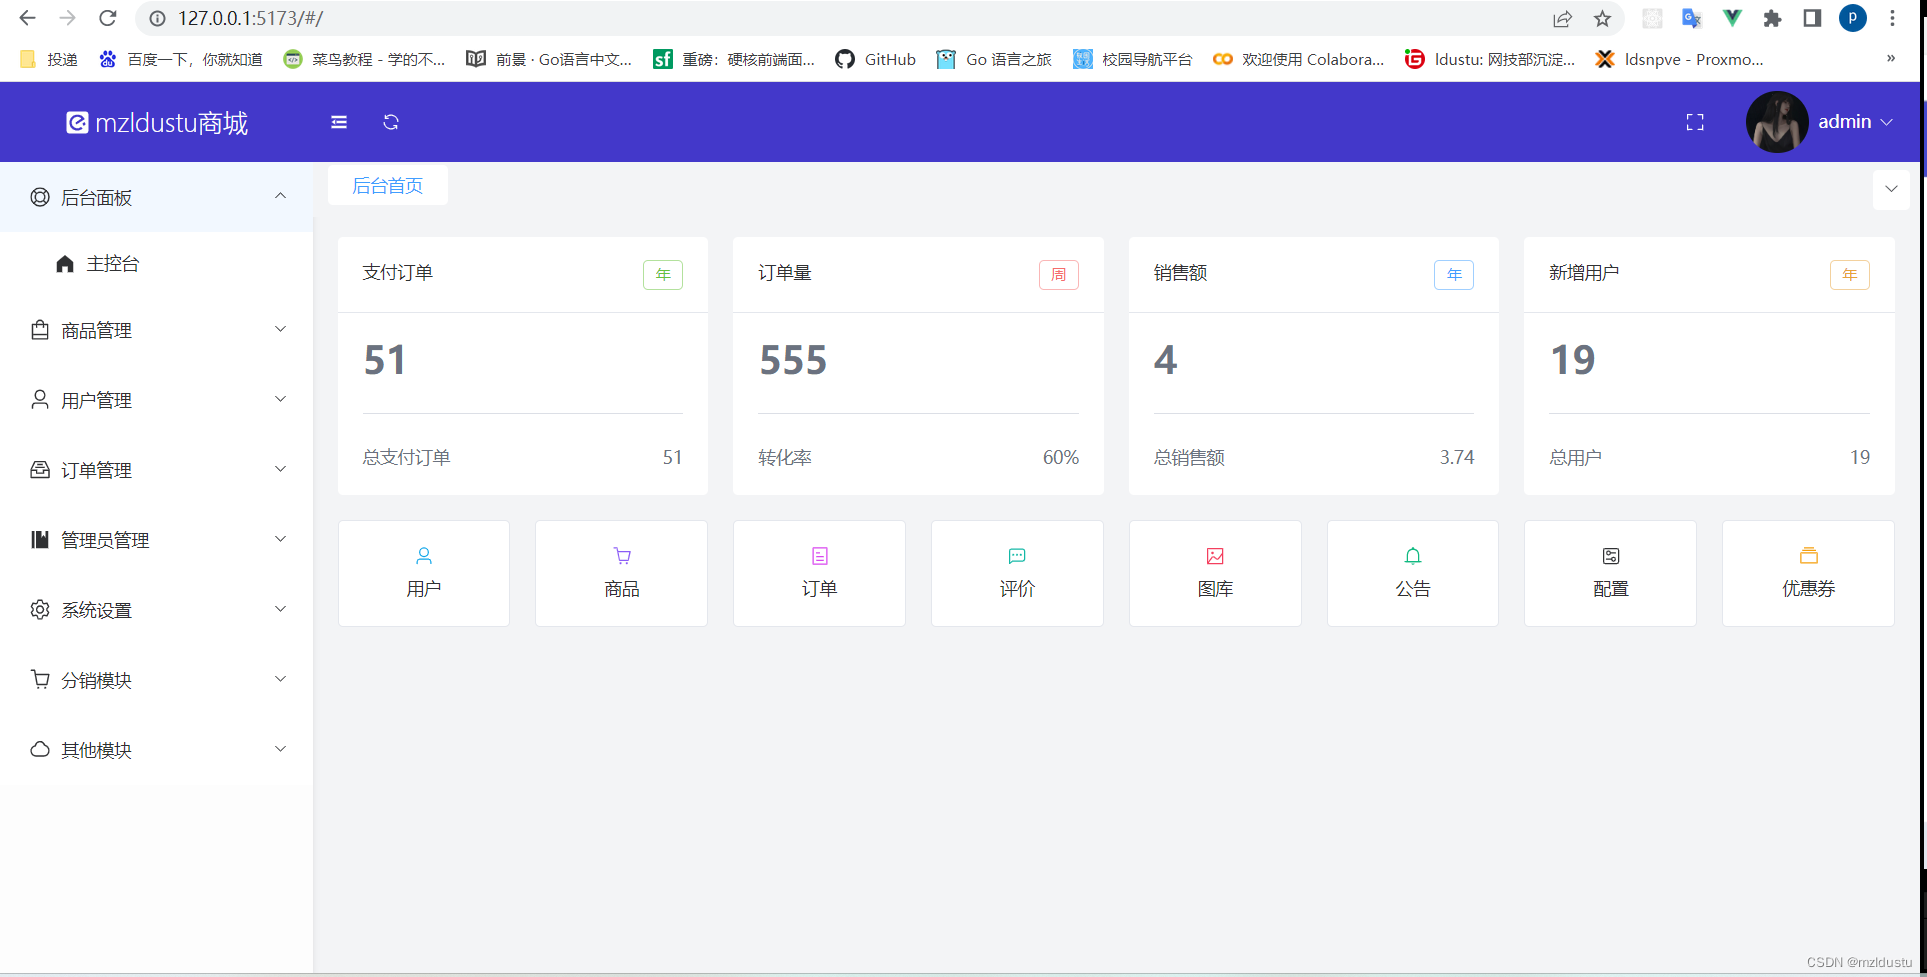
这就是那第二行的一串图标。
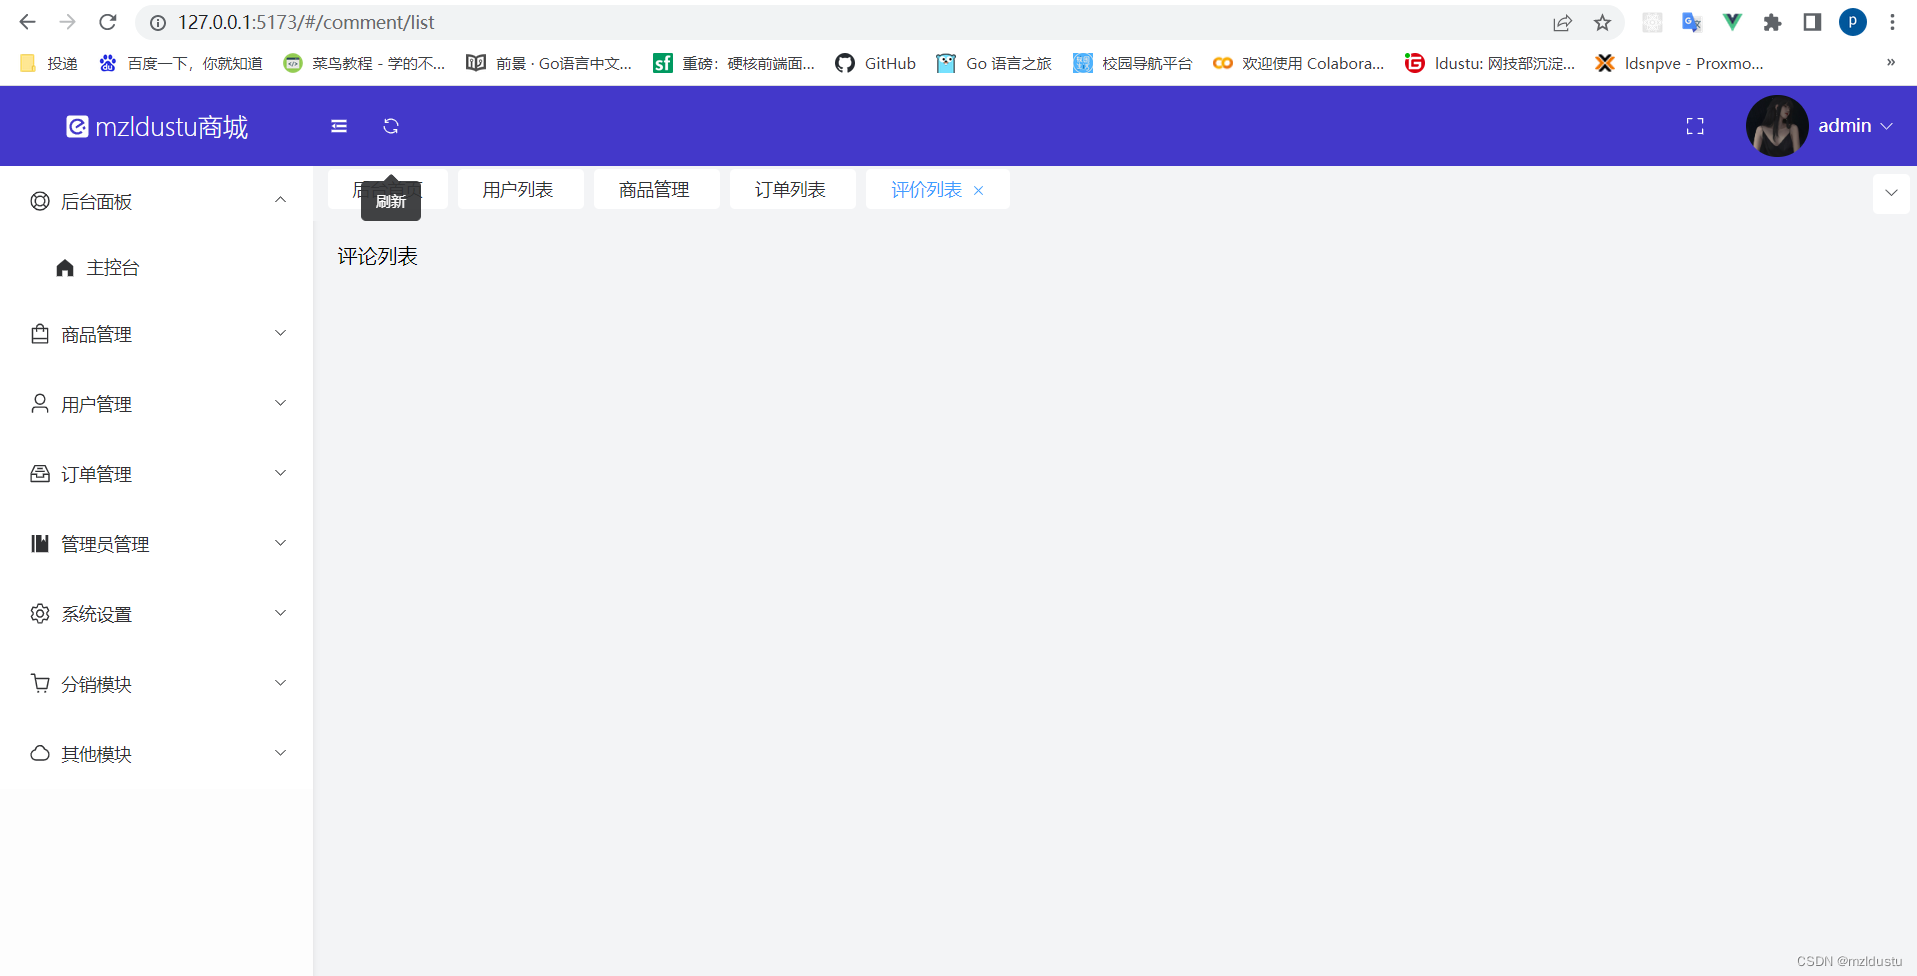
然后跳转的话就上面代码里加了@click="$router.push(item.path)"
然后再在pages文件夹下面创建每一个页面的文件夹以及vue文件,并写上template,像这样
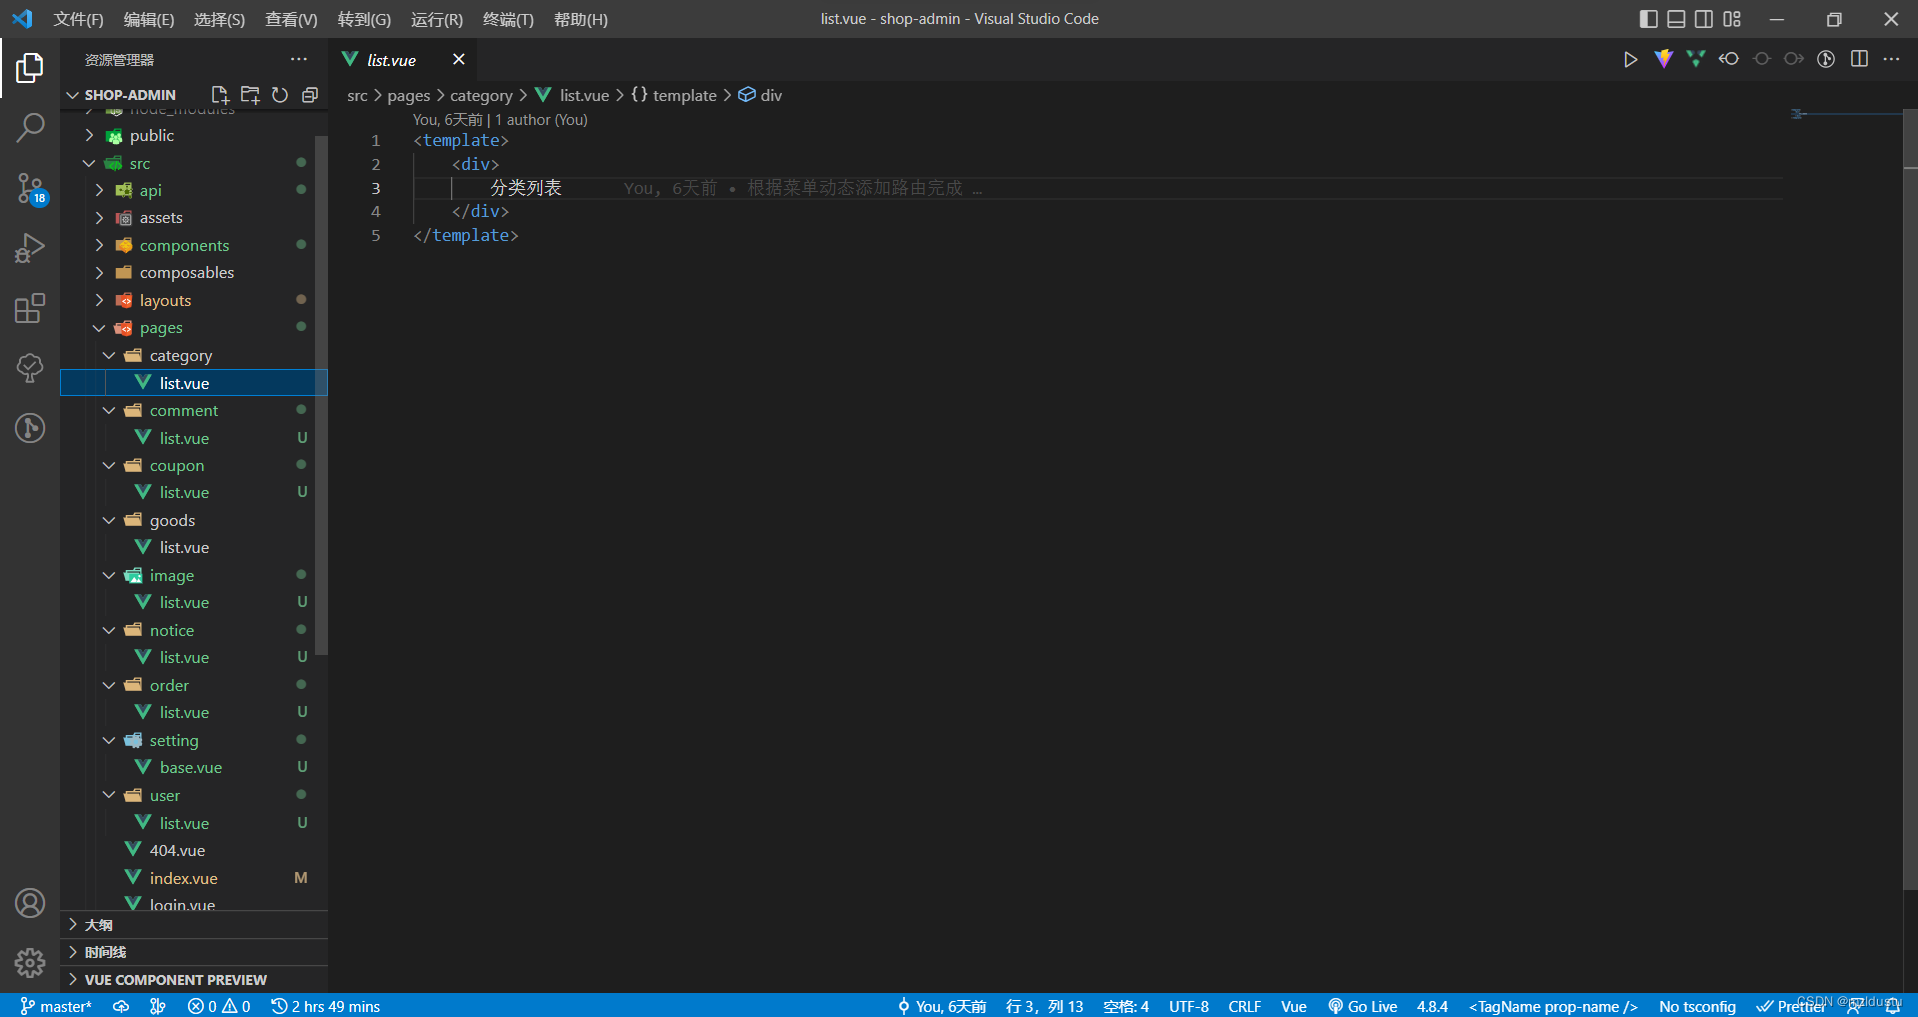
然后配置路由,在router文件夹下面的Index.js
import { createRouter, createWebHashHistory } from "vue-router";
import Index from "~/pages/index.vue";
import Login from "~/pages/login.vue";
import NotFound from "~/pages/404.vue";
import GoodList from "~/pages/goods/list.vue";
import CategoryList from "~/pages/category/list.vue";
// 引入主布局
import Admin from "~/layouts/admin.vue";
import UserList from "~/pages/user/list.vue";
import OrderList from "~/pages/order/list.vue";
import CommentList from "~/pages/comment/list.vue";
import ImageList from "~/pages/image/list.vue";
import NoticeList from "~/pages/notice/list.vue";
import SettingBase from "~/pages/setting/base.vue";
import CouponList from "~/pages/coupon/list.vue";


// 这里是之前写死的路由,改成了后面的动态获取路由
// const routes = [{
//     // 根路由
//     path:"/",
//     component:Admin,
//     // 子路由
//     children:[{
//         path:"/",
//         component:Index,
//         meta:{
//             title:"后台首页"
//         }
//     },{
//         path:"/goods/list",
//         component:GoodList,
//         meta:{
//             title:"商品管理"
//         }
//     },{
//         path:"/category/list",
//         component:CategoryList,
//         meta:{
//             title:"分类列表"
//         }
//     }]
// },{
//     // 登录路由
//     path:"/login",
//     component:Login,
//     meta:{
//         title:"登录页"
//     }
// },{
//     //404路由 将匹配所有内容并将其放在 `$route.params.pathMatch` 下
//     path: '/:pathMatch(.*)*',
//     name: 'NotFound',
//     component: NotFound
// }]

// 这是默认路由,所有用户共享
const routes = [
  {
    // 后台布局
    path: "/",
    // 加上name属性是因为添加嵌套路由的时候要指向父路由的name值
    name: "admin",
    component: Admin,
  },
  {
    // 登录路由
    path: "/login",
    component: Login,
    meta: {
      title: "登录页",
    },
  },
  {
    //404路由 将匹配所有内容并将其放在 `$route.params.pathMatch` 下
    path: "/:pathMatch(.*)*",
    name: "NotFound",
    component: NotFound,
  },
];

// 动态路由,用于匹配菜单动态添加路由,包含上面的子路由
const asyncRoutes = [
  {
    path: "/",
    // name值方便hasRoute进行查找
    name: "/",
    component: Index,
    meta: {
      title: "后台首页",
    },
  },
  {
    path: "/goods/list",
    name: "/goods/list",
    component: GoodList,
    meta: {
      title: "商品管理",
    },
  },
  {
    path: "/category/list",
    name: "/category/list",
    component: CategoryList,
    meta: {
      title: "分类列表",
    },
  },
  {
    path: "/user/list",
    name: "/user/list",
    component: UserList,
    meta: {
      title: "用户列表",
    },
  },
  {
    path: "/order/list",
    name: "/order/list",
    component: OrderList,
    meta: {
      title: "订单列表",
    },
  },
  {
    path: "/comment/list",
    name: "/comment/list",
    component: CommentList,
    meta: {
      title: "评价列表",
    },
  },
  {
    path: "/image/list",
    name: "/image/list",
    component: ImageList,
    meta: {
      title: "图库列表",
    },
  },
  {
    path: "/notice/list",
    name: "/notice/list",
    component: NoticeList,
    meta: {
      title: "公告列表",
    },
  },
  {
    path: "/setting/base",
    name: "/setting/base",
    component: SettingBase,
    meta: {
      title: "配置",
    },
  },
  {
    path: "/coupon/list",
    name: "/coupon/list",
    component: CouponList,
    meta: {
      title: "优惠券列表",
    },
  },
];

// 创建路由
export const router = createRouter({
  history: createWebHashHistory(),
  routes,
});

// export default router

// 动态路由效果:根据后端返回的菜单添加路由,如果没有这个菜单,就不添加
// 定义一个动态添加路由的方法:
// 运用递归往里一层一层循环拿到里面的路径匹配前端定义的动态路由进行匹配,
// 如果是,那就拿到上面的数组里,然后判断这个路由是不是已经注册,如果没有注册,那就添加,如果注册了就跳过。
// 接收后端传过来的菜单数组menus,但是菜单数组多少个层级是不知道的
export function addRoutes(menus) {
  // 是否有新的路由,默认设置为false
  let hasNewRoutes = false;
  // 要给他接收一个数组,是菜单的数据
  const findAndAddRouteByMenus = (arr) => {
    // 拿到之后用forEach进行遍历
    arr.forEach((e) => {
      // e.frontpath拿到菜单的路径,跟动态路由数组进行匹配,
      // 通过o拿到数组里面单独的一个对象,并拿到里面的path,在跟后端菜单传过来的进行匹配并赋值给item
      let item = asyncRoutes.find((o) => o.path == e.frontpath);
      //   如果有item并且通过hasRoute(方法里面传的是name值,所以上面的路由要有name值)判断是否之前已经注册过路由,如果没有注册过
      if (item && !router.hasRoute(item.path)) {
        // 添加路由,并且指定父级路由的name叫admin,再把当前拿到的对象item传入进来
        router.addRoute("admin", item);
        // 确实有新的路由了
        hasNewRoutes = true;
      }
      //判断是否存在子菜单,如果存在并且它长度大于0,说明有子路由
      if (e.child && e.child.length > 0) {
        // 就再调用一次,传进的数组就是子路由的数组e.child
        findAndAddRouteByMenus(e.child);
      }
    });
  };
  // 在外层执行,要把addRoutes里面接收的menus传入进来
  findAndAddRouteByMenus(menus);
  // 获取现在所有路由数组
  // console.log(router.getRoutes);
  // 将值返回回去
  return hasNewRoutes;
}
这样就能实现分类组件的开发以及每个分类页面的跳转了。
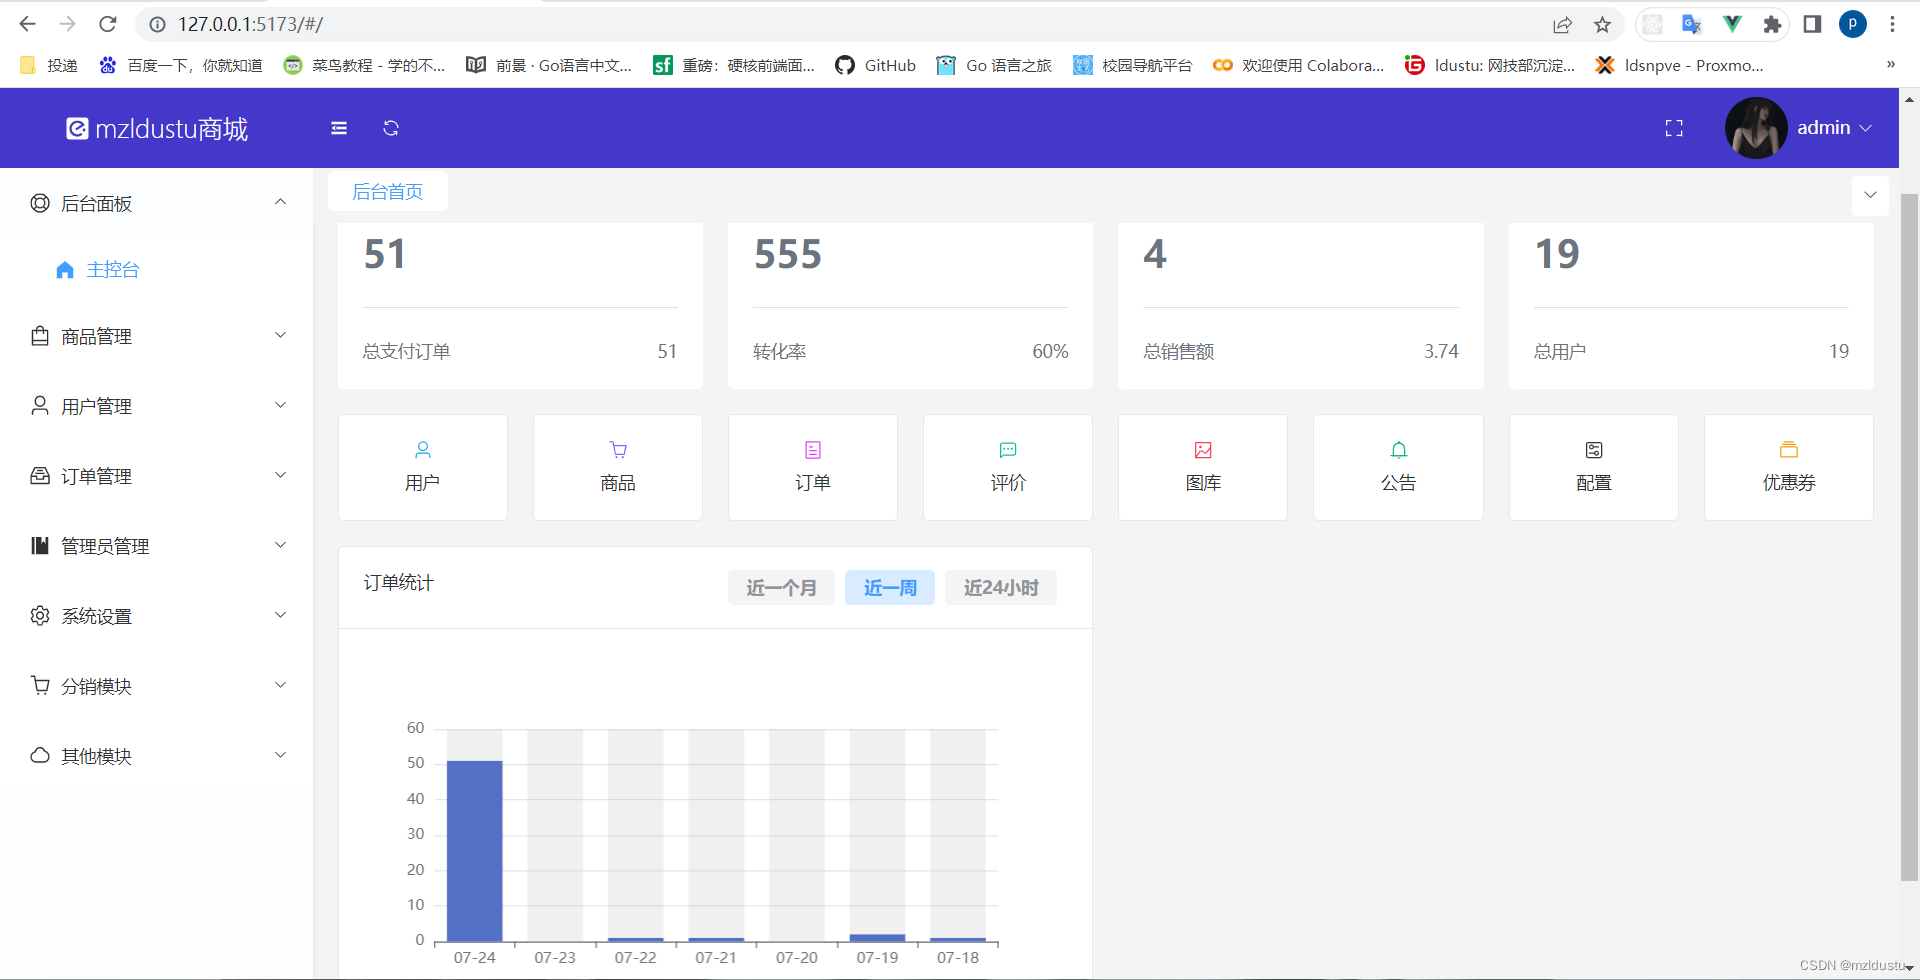
然后我们继续来进行echarts图表组件的开发和交互。
先安装
npm install echarts
在components文件夹下创建IndexChart.vue,然后主要就是进行echart里面的柱状图的调用,传给其x轴和y轴的值
<template>
    <el-card shadow="never">
        <template #header>
            <div class="flex justify-between">
                <span class="text-sm">订单统计</span>
                <div>
                    <!-- tag标签里面的可选中标签 -->
                    <!-- :checked是动态的是否选中 -->
                    <el-check-tag v-for="(item, index) in options" :key="index" :checked="current == item.value" checked
                        style="margin-right: 8px" @click="handleChoose(item.value)">
                        {{ item.text }}
                    </el-check-tag>
                </div>
            </div>
        </template>
        <div ref="el" id="chart" style="width: 100%; height: 300px;">

        </div>
    </el-card>
</template>

<script setup>
// 引入echart
import * as echarts from 'echarts';
// 一定要渲染完才能拿到echart的dom元素
import { ref, onMounted, onBeforeUnmount } from 'vue'
// 引入echart的api接口
import { getStatistics3 } from '~/api/index.js'
// 引入vueuse提供的监听页面大小的方法,做页面适配
import { useResizeObserver } from '@vueuse/core'

// 当前选中
const current = ref("week")

// 可选标签选项
const options = [{
    text: "近一个月",
    value: "month"
}, {
    text: "近一周",
    value: "week"
}, {
    text: "近24小时",
    value: "hour"
},]

// 选中选项卡
const handleChoose = (type) => {
    current.value = type
    // 切换type就重新获取数据
    getData()
}

// 在页面渲染完之后拿到dom值
// myChart先默认为null
var myChart = null
onMounted(() => {
    // 拿到dom
    var chartDom = document.getElementById('chart');
    myChart = echarts.init(chartDom);
    getData()
})

// 销毁页面的时候要顺便把echart对象myChart释放掉,不然会白屏,打包之后会出现这种情况
// 页面被销毁之前
onBeforeUnmount(() => {
    // 调用echarts.dispose()销毁实例
    if (myChart) echarts.dispose(myChart)
})

function getData() {
    let option = {
        xAxis: {
            type: 'category',
            data: []
        },
        yAxis: {
            type: 'value'
        },
        series: [
            {
                data: [],
                type: 'bar',
                showBackground: true,
                backgroundStyle: {
                    color: 'rgba(180, 180, 180, 0.2)'
                }
            }
        ]
    };

    // 获取数据之前loading
    myChart.showLoading()

    // 当前选中的值先传入进来,然后.then拿到数据结果
    getStatistics3(current.value).then(res => {
        // 可以拿到x,y轴数据了
        // console.log(res)
        option.xAxis.data = res.x
        option.series[0].data = res.y
        // 调用
        myChart.setOption(option)
    }).finally(() => {
        // 结束调用之后把loading隐藏
        myChart.hideLoading()
    })
}

const el = ref(null)
useResizeObserver(el, (entries) => {
    myChart.resize()
})
</script>
在api文件夹下的index.js写echart的接口:
import axios from '~/axios'

// 主控面板第一行数据接口
export function getStatistics1(){
    return axios.get("/admin/statistics1")
}

// echarts图表的数据接口
export function getStatistics3(type){
    return axios.get("/admin/statistics3?type="+type)
}
在index.vue里调用
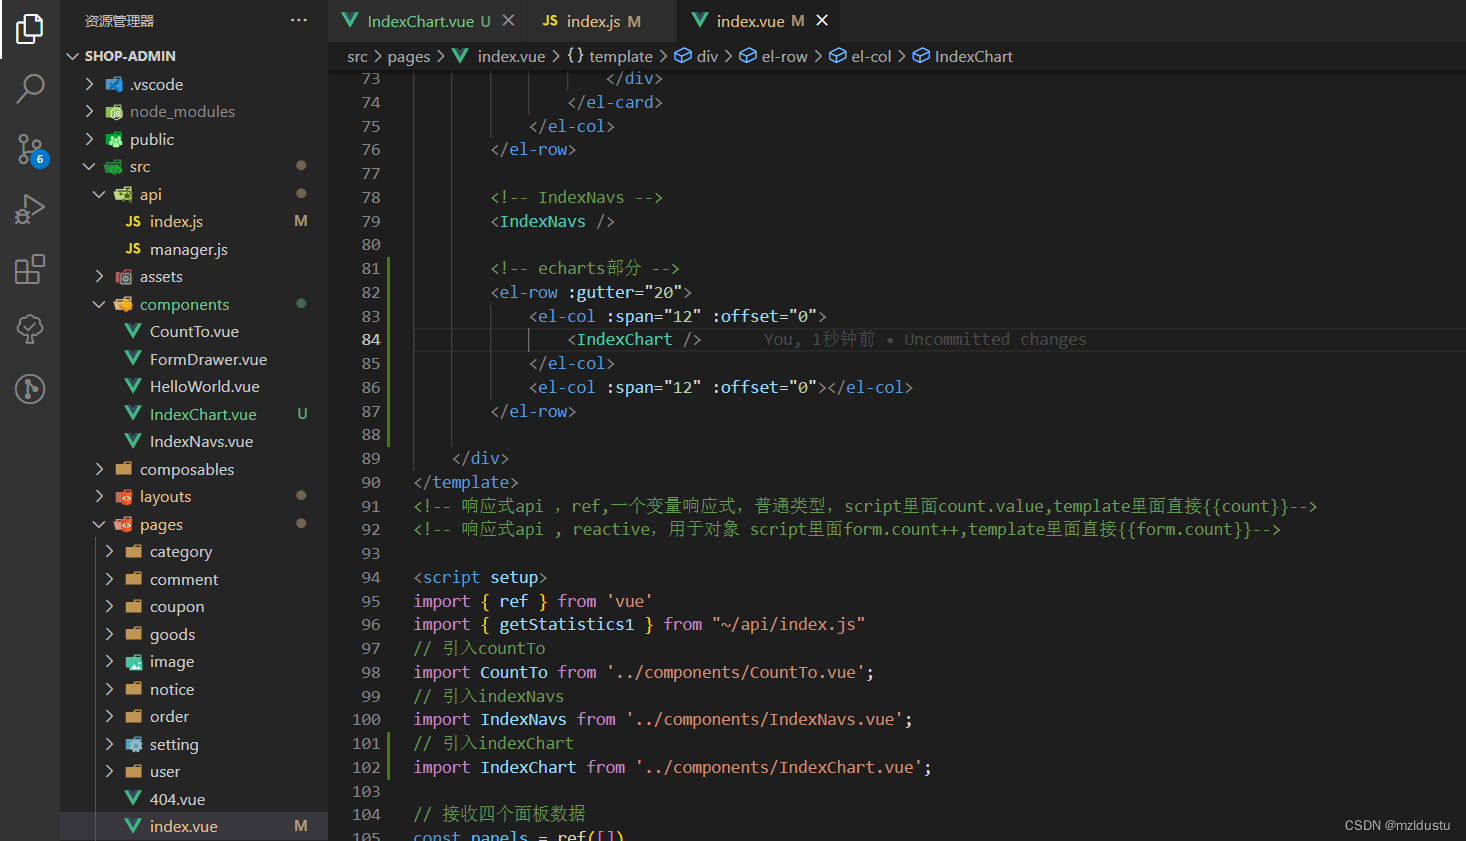
到此,echart部分就开发结束了,来看目前效果:
然后我们继续店铺和交易提示组件开发与交互。
首先api文件夹下面的index.js里面:
import axios from '~/axios'

// 主控面板第一行数据接口
export function getStatistics1(){
    return axios.get("/admin/statistics1")
}

// 拿到店铺数据
export function getStatistics2(){
    return axios.get("/admin/statistics2")
}

// echarts图表的数据接口
export function getStatistics3(type){
    return axios.get("/admin/statistics3?type="+type)
}
然后在components下面创建IndexCard.vue
然后
<template>
    <el-card shadow="never">
        <template #header>
            <!-- 利用flex布局的左右布局justify-between -->
            <div class="flex justify-between">
                <!-- 字体大小改为text-sm -->
                <span class="text-sm">{{ title }}</span>
                <!-- 颜色值是红色danger -->
                <el-tag :type="danger" effect="plain">
                    <!-- 后端返回的值 -->
                    {{ tip }}
                </el-tag>
            </div>
        </template>
        <!-- card body -->
        <el-row :gutter="20">
            <el-col :span="6" :offset="0" v-for="(item,index) in btns" :key="index">
                <el-card shadow="hover" class="border-0 bg-light-400">
                    <div class="flex flex-col items-center justify-center">
                        <span class="text-xl mb-2">{{ item.value }}</span>
                        <span class="text-xs text-gray-500">{{ item.label }}</span>
                    </div>
                </el-card>

            </el-col>
        </el-row>

    </el-card>

</template>

<script setup>
defineProps({
    title: String,
    tip: String,
    btns: Array
})
</script>
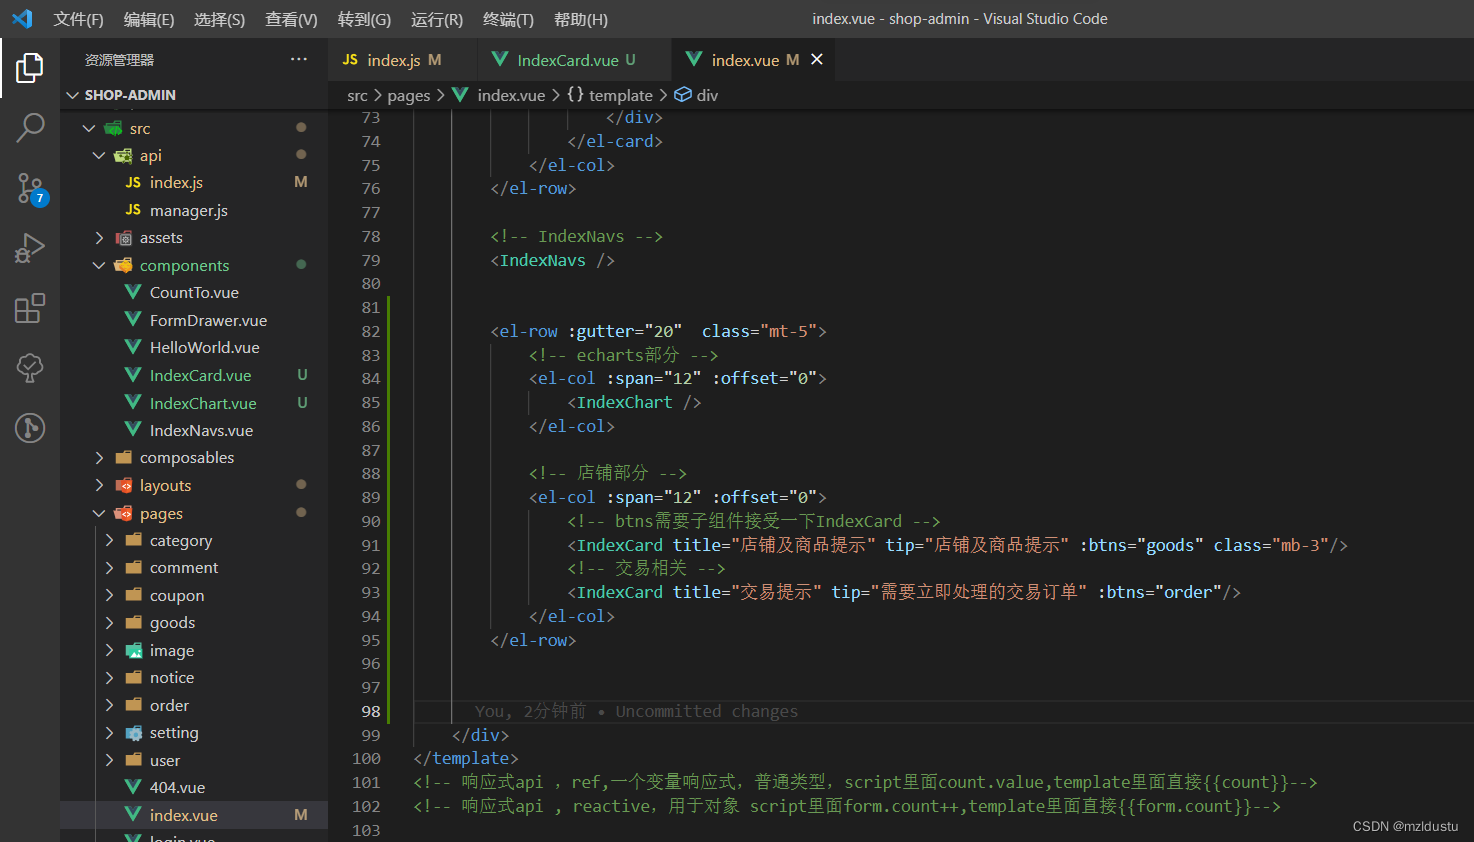
在index.vue里面:加上店铺部分和交易相关
然后运行结果:完全没有问题
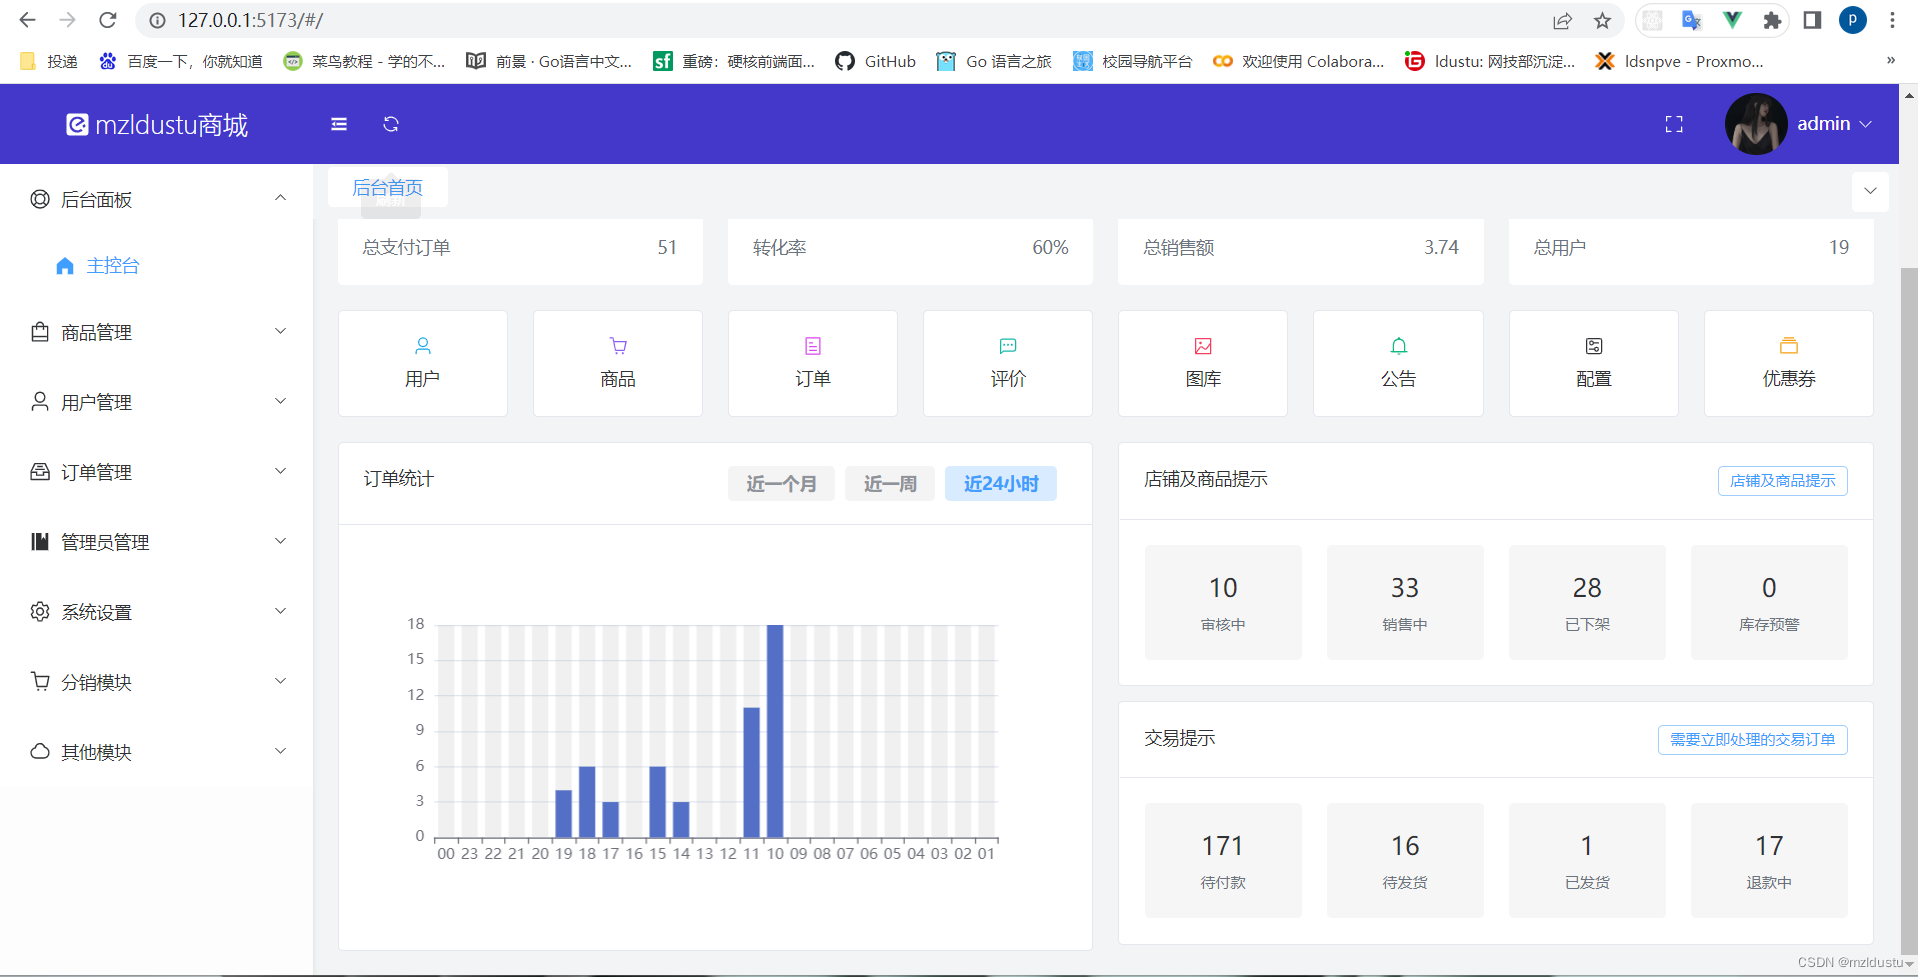
到此为止,我们的主页部分就全部开发完了,撒花!明天开始会继续其他部分的开发,大家一起加油啊!