目录
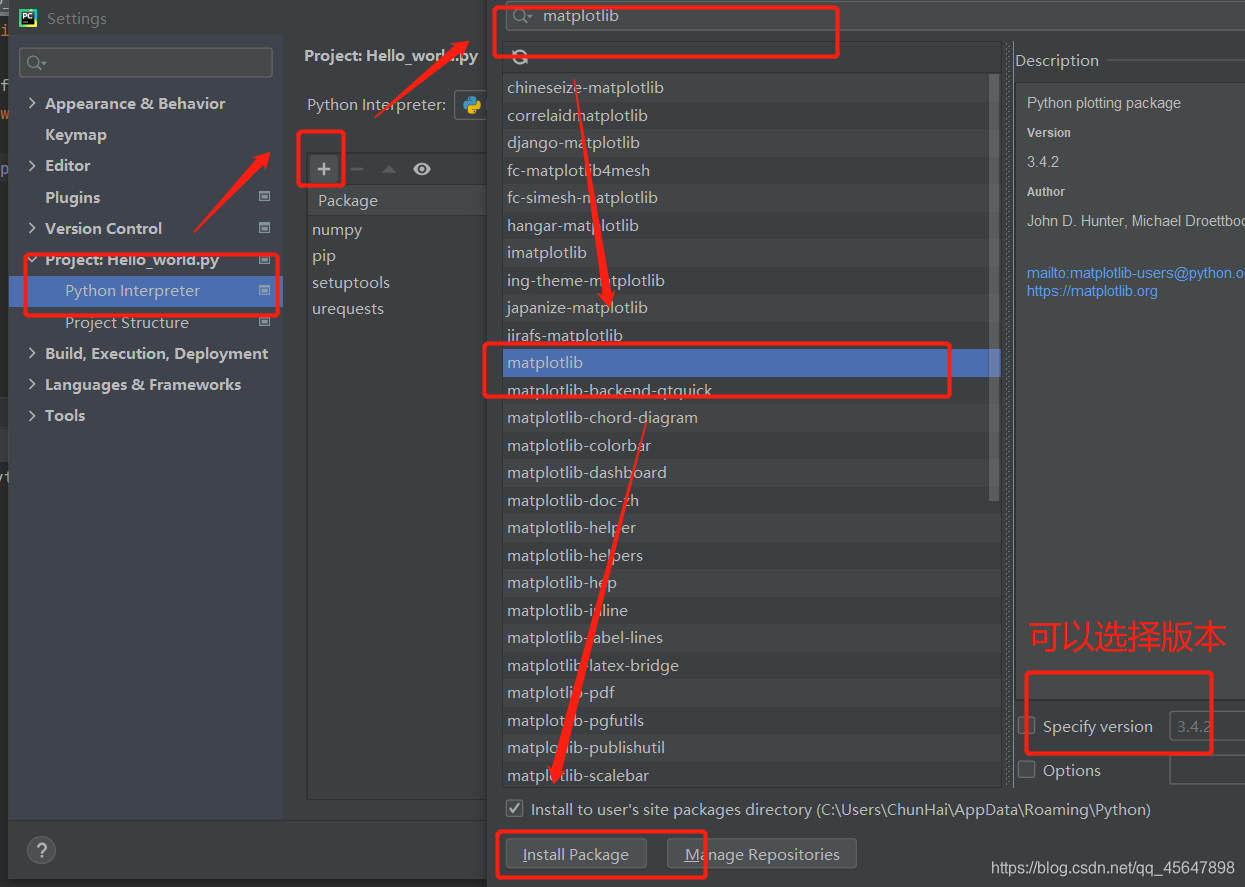
一、安装matplotlib
? ? ? ? 在PyCharm中安装很简单,File--Settings--Project--Python Interpreter

?二、绘制简单的折线
import matplotlib.pyplot as plt

squares=[1,4,9,16,25,49]

plt.plot(squares)
plt.show()
?1、修改标签和文字
import matplotlib.pyplot as plt

squares=[1,4,9,16,25,49]

plt.plot(squares,linewidth=7)
'''设置标题,坐标轴'''
plt.title('Square Numbers',fontsize=24)
plt.xlabel('Value',fontsize=24)
plt.ylabel('Square of Value',fontsize=14)

'''刻度标记'''
plt.tick_params(axis='both',labelsize=14)
plt.show()
2、校正图形
import matplotlib.pyplot as plt
values=[1,2,3,4,5,7]
squares=[1,4,9,16,25,49]

plt.plot(values,squares,linewidth=7)
'''设置标题,坐标轴'''
plt.title('Square Numbers',fontsize=24)
plt.xlabel('Value',fontsize=24)
plt.ylabel('Square of Value',fontsize=14)

'''刻度标记'''
plt.tick_params(axis='both',labelsize=14)
plt.show()
?3、使用scatter()绘制散点图并设置其格式
import matplotlib.pyplot as plt

plt.scatter(2,4)


'''设置标题,坐标轴'''
plt.title('Square Numbers',fontsize=24)
plt.xlabel('Value',fontsize=24)
plt.ylabel('Square of Value',fontsize=14)

'''刻度标记'''
plt.tick_params(axis='both',labelsize=14)
plt.show()
4、使用scatter()绘制一系列点
import matplotlib.pyplot as plt

x=[1,2,3,4,5]
y=[1,4,9,16,25]
plt.scatter(x,y,s=100)


'''设置标题,坐标轴'''
plt.title('Square Numbers',fontsize=24)
plt.xlabel('Value',fontsize=24)
plt.ylabel('Square of Value',fontsize=14)

'''刻度标记'''
plt.tick_params(axis='both',labelsize=14)
plt.show()
?5、自动计算数据
import matplotlib.pyplot as plt

x=list(range(1,1001))
y=[_x**2 for _x in x]
plt.scatter(x,y,s=40)


'''设置标题,坐标轴'''
plt.title('Square Numbers',fontsize=24)
plt.xlabel('Value',fontsize=24)
plt.ylabel('Square of Value',fontsize=14)

'''刻度标记'''
plt.tick_params(axis='both',labelsize=14)

'''设置每个坐标的取值范围'''
plt.axis([0,1100,0,1100000])
plt.show()
6、删除数据点的轮廓
plt.scatter(x,y,edgecolor='none',s=40)7、自定义颜色
plt.scatter(x,y,c='yellow',edgecolor='none',s=40)
?8、使用颜色映射
plt.scatter(x,y,c=y,cmap=plt.cm.Blues,edgecolor='none',s=40)
?9、自动保存图表
plt.savefig('squares_plot.png',bbox_inches='tight')
'''第一个实参指定文件名,第二个实参指定将图表多余的空白区域裁剪掉'''
文章若有错误,请指正!