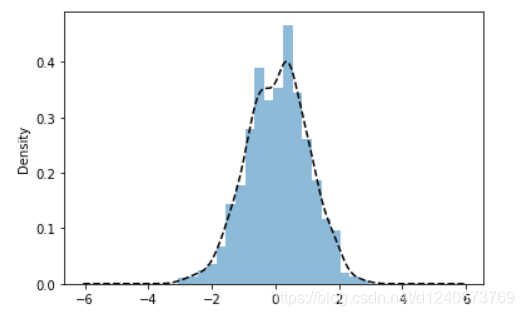
直方图、密度图
import numpy as np
import pandas as pd
import matplotlib.pyplot as plt
%matplotlib inline
s = pd.Series(np.random.randn(1000))
s.hist(bins = 20,
histtype = 'bar',
align = 'mid',
orientation = 'vertical',
alpha=0.5,
density=True)
s.plot(kind='kde',style='k--')

堆叠直方图
plt.figure(num=1)
df = pd.DataFrame({'a': np.random.randn(1000) + 1, 'b': np.random.randn(1000),
'c': np.random.randn(1000) - 1, 'd': np.random.randn(1000)-2},
columns=['a', 'b', 'c','d'])
df.plot.hist(stacked=True,
bins=20,
colormap='Greens_r',
alpha=0.5,
grid=True)
df.hist(bins=50)

散点图 - plt.scatter()
plt.figure(figsize=(8,6))
x = np.random.randn(1000)
y = np.random.randn(1000)
plt.scatter(x,y,marker='.',
s = np.random.randn(1000)*100,
cmap = 'Reds',
c = y,
alpha = 0.8,)
plt.grid()

散点矩阵 - pd.scatter_matrix()
df = pd.DataFrame(np.random.randn(100,4),columns = ['a','b','c','d'])
pd.plotting.scatter_matrix(df,figsize=(10,6),
marker = 'o',
diagonal='kde',
alpha = 0.5,
range_padding=0.1)

极坐标图
s = pd.Series(np.arange(20))
theta=np.arange(0,2*np.pi,0.02)
print(s.head())
print(theta[:10])
fig = plt.figure(figsize=(10,6))
ax1 = plt.subplot(121, projection = 'polar')
ax2 = plt.subplot(122)
ax1.plot(theta,theta*3,linestyle = '--',lw=1)
ax1.plot(s, linestyle = '--', marker = '.',lw=2)
ax2.plot(theta,theta*3,linestyle = '--',lw=1)
ax2.plot(s)
plt.grid()

极坐标参数设置
theta=np.arange(0,2*np.pi,0.02)
plt.figure(figsize=(10,6))
ax1= plt.subplot(121, projection='polar')
ax2= plt.subplot(122, projection='polar')
ax1.plot(theta,theta/6,'--',lw=2)
ax2.plot(theta,theta/6,'--',lw=2)
ax2.set_theta_direction(-1)
ax2.set_thetagrids(np.arange(0.0, 360.0, 90),['a','b','c','d'])
ax2.set_rgrids(np.arange(0.2,2,0.4))
ax2.set_theta_offset(np.pi/2)
ax2.set_rlim(0.2,1.2)
ax2.set_rmax(2)
ax2.set_rticks(np.arange(0.1, 1.5, 0.2))

雷达图1 - 极坐标的折线图/填图 - plt.plot()
plt.figure(figsize=(10,6))
ax1= plt.subplot(111, projection='polar')
ax1.set_title('radar map\n')
ax1.set_rlim(0,12)
data1 = np.random.randint(1,10,10)
data2 = np.random.randint(1,10,10)
data3 = np.random.randint(1,10,10)
theta=np.arange(0,2*np.pi,2*np.pi/10)
ax1.plot(theta,data1,'.--',label='data1')
ax1.fill(theta,data1,alpha=0.2)
ax1.plot(theta,data2,'.--',label='data2')
ax1.fill(theta,data2,alpha=0.2)
ax1.plot(theta,data3,'.--',label='data3')
ax1.fill(theta,data3,alpha=0.2)

雷达图2 - 极坐标的折线图/填图 - plt.polar()
labels = np.array(['a','b','c','d','e','f'])
dataLenth = 6
data1 = np.random.randint(0,10,6)
data2 = np.random.randint(0,10,6)
angles = np.linspace(0, 2*np.pi, dataLenth, endpoint=False)
data1 = np.concatenate((data1, [data1[0]]))
data2 = np.concatenate((data2, [data2[0]]))
angles = np.concatenate((angles, [angles[0]]))
plt.polar(angles, data1, 'o-', linewidth=1)
plt.fill(angles, data1, alpha=0.25)
plt.polar(angles, data2, 'o-', linewidth=1)
plt.fill(angles, data2, alpha=0.25)
plt.thetagrids(angles * 180/np.pi, labels)
plt.ylim(0,10)

极轴图 - 极坐标的柱状图
plt.figure(figsize=(10,6))
ax1= plt.subplot(111, projection='polar')
ax1.set_title('radar map\n')
ax1.set_rlim(0,12)
data = np.random.randint(1,10,10)
theta=np.arange(0,2*np.pi,2*np.pi/10)
bar = ax1.bar(theta,data,alpha=0.5)
for r,bar in zip(data, bar):
bar.set_facecolor(plt.cm.jet(r/10.))
plt.thetagrids(np.arange(0.0, 360.0, 90), [])

|


