文章目录
3 Matplotlib
3.1 figure、axes、axis
ax1 = plt.subplot(221)
ax2 = plt.subplot(222)
ax3 = plt.subplot(223)
ax4 = plt.subplot(224)
plt.show()
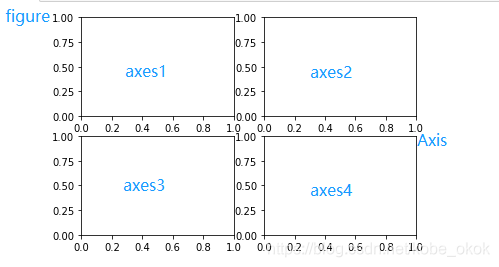
由上图可以看出,figure是一个画布,一个画布上可以画多个坐标系(axes),每个(二维)坐标系有两个轴(axis),相信大家看到上图就能够知道画布,坐标系和坐标轴三者之间的关系。
3.2 图像布局
3.2.1 plt.subplot()
上例中使用的也是一种图像布局的方法,将一个画布分成四个部分,将四个坐标系分别命名成ax1,ax2,ax3,ax4
3.2.2 plt.subplots()
fig,ax=plt.subplots(2,2)
ax[0,0].plot([1,2,3],[1,2,3])
ax[0,1].scatter([1,2,3],[1,2,3])
ax[1,0].bar([1,2,3],[1,2,3])
ax[1,1].pie([10,20,30])
plt.show()

3.3 折线图-plt.plot()
面向对象制图
fig = plt.figure(figsize=(8,6)) # 创建一个画布
axes = fig.add_subplot()        # 新建一个子坐标系
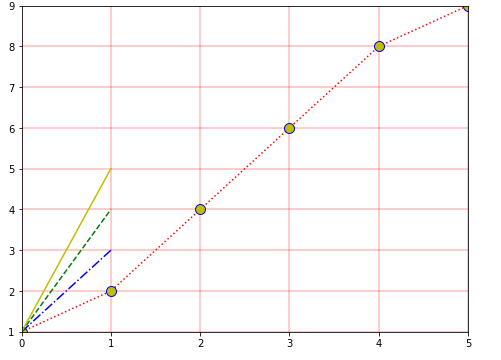
axes.plot([0,1,2,3,4,5], [1,2,4,6,8,9],c='r',ls=':',marker='o',markersize='10',mec='b',mfc='y')  # 画折线图
axes.plot([1,3],c='b',ls='-.')
axes.plot([1,4],c='g',ls='--')
axes.plot([1,5],c='y',ls='-')
axes.grid(True,color='r', linestyle='-', linewidth=2, alpha=0.2)  # 添加背景方格
axes.set_xmargin(0) #图形到底边的距离
axes.set_ymargin(0) #图形到左边的距离
plt.show()
使用循环画多个图
fig = plt.figure(figsize=(8,6)) # 新建画布
config = {
    'c':['r','g','b','y'],
    'ls':['-','-.','--',':'],
    'lw':[1,2,3,4],
} # 配置项
ax = fig.add_subplot() # 添加坐标系
for i in range(4):
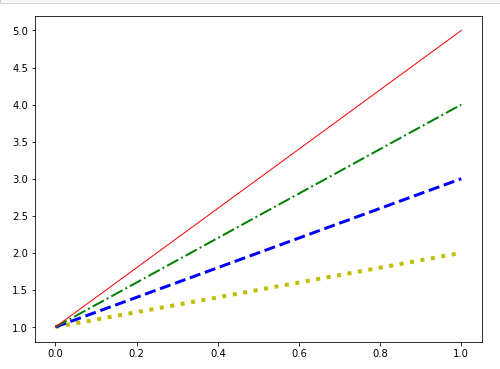
    ax.plot([1,i+2],c=config['c'].pop(),ls=config['ls'].pop(),lw=config['lw'].pop())
# 循环画四个折线图
plt.show()
 > 常用参数说明
xdata,ydata : # 具有相同维度的数据
c or color  : # 颜色
# 常用颜色列表:
=============    ===============================
character        color
=============    ===============================
``'b'``          blue
``'g'``          green
``'r'``          red
``'c'``          cyan
``'m'``          magenta
``'y'``          yellow
``'k'``          black
``'w'``          white
=============    ===============================
linestyle or ls : # 线型
# 支持的线型:
=============    ===============================
character        description
=============    ===============================
``'-'``          solid line style
``'--'``         dashed line style
``'-.'``         dash-dot line style
``':'``          dotted line style
=============    ===============================
linewidth or lw : #  线宽 float
marker :         #  数据点的类型
# 常用的marker:
=============   ===============================
character       description
=============   ===============================
``'.'``         point marker
``','``         pixel marker
``'o'``         circle marker
``'v'``         triangle_down marker
``'^'``         triangle_up marker
``'<'``         triangle_left marker
``'>'``         triangle_right marker
``'1'``         tri_down marker
``'2'``         tri_up marker
``'3'``         tri_left marker
``'4'``         tri_right marker
``'8'``         octagon marker
``'s'``         square marker
``'p'``         pentagon marker
``'P'``         plus (filled) marker
``'*'``         star marker
``'h'``         hexagon1 marker
``'H'``         hexagon2 marker
``'+'``         plus marker
``'x'``         x marker
``'X'``         x (filled) marker
``'D'``         diamond marker
``'d'``         thin_diamond marker
``'|'``         vline marker
``'_'``         hline marker
=============   ===============================
markeredgecolor or mfc :        #数据点的边框颜色
markeredgewidth or mew: float   #数据点的边框粗细
markerfacecolor or mfc: color   #数据点前景色
markersize or ms: float         #数据点的大小
markevery: None or int or (int, int) or slice or list[int] or float or (float, float) or list[bool]                      #每个点是不是应该有数据
# 对于上面的第一个例子
# 设置:markevery=[False,True,True,False,False,False]
# 则那么只有(1,2),(2,4)这两个点显示
fmt = '[marker][line][color]'
# 可以将marker=’o‘,line=':',color='r' 简写成 ‘o:r’
3.4 散点图-plt.scatter()
fig = plt.figure()
ax = fig.add_subplot()
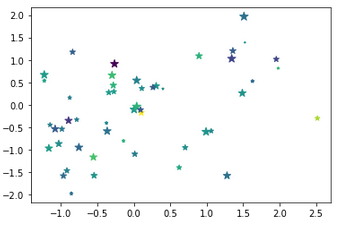
ax.scatter(x=np.random.randn(50),y=np.random.randn(50),s=np.random.randint(0,100,50),c=np.random.randn(50),marker='*')
plt.show()
# s : size
# c : color
# 其余参数和plot都差不多
3.5 柱状图-plt.bar()
垂直柱状图
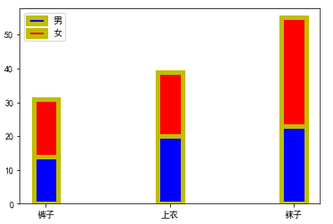
plt.rcParams['font.sans-serif'] = "SimHei"
fig = plt.figure()
ax = fig.add_subplot()
x = ['裤子','上衣','袜子']
y1 = [14,20,23]
y2 = [17,19,32]
ax.bar(
    x=x,     # x坐标
    height=y1,  # 柱状图高度
    width=0.2,  # 柱状图高度
    align='center', # 对齐方式'center' or ‘edge’
    bottom=0, # 底部坐标
    color = 'b', # 颜色 字符或者字符列表
    edgecolor = 'y', # 边框颜色
    linewidth = 5,  # 边框宽度
    # tick_label = [], 修改x轴的标注
)
ax.set_label('男生')
ax.bar(
    x=x,
    height=y2,
    width=0.2,
    align='center',
    bottom=y1,
    color = 'r',
    edgecolor = 'y',
    linewidth = 5,
    # tick_label = [], 修改x轴的标注
)

ax.set_label("女生")
ax.legend(["男","女"]) # 设置图例
plt.show()
横向柱状图
plt.rcParams['font.sans-serif'] = "SimHei"
fig = plt.figure()
ax = fig.add_subplot()
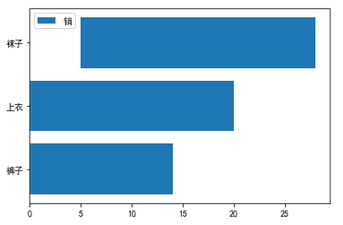
x = ['裤子','上衣','袜子']
y1 = [14,20,23]
ax.barh(y=x,width=y1,height=0.8,left=[0,0,5])

ax.legend("销量")
plt.show(
直方图
hz,bins = np.histogram(np.random.randint(1,100,5000),bins=np.linspace(0,100,100))
hz,bins
plt.bar(x=bins[:-1],height=hz)

3.6 饼状图-plt.pie()
plt.rcParams['font.sans-serif'] = "SimHei"
fig = plt.figure()
ax = fig.add_subplot()
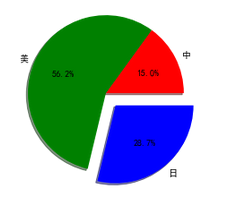
ax.pie(x=[12,45,23],explode=np.array([0,0,0.2]),labels=list("中美日"),colors=list('rgb'),autopct='%1.1f%%',shadow=True)
plt.show()

#参数说明:
3.7 fontdict
# 默认设置
{'fontsize': 	rcParams['axes.titlesize'],
                'fontweight': rcParams['axes.titleweight'],
                'color': rcParams['axes.titlecolor'],
                'verticalalignment': 'baseline',
                'horizontalalignment': loc}
附件0 综合练习
x = np.arange(-5,6,1) # X轴测试数据
y = 2*x + 5			  # Y轴测试数据
fig, ax = plt.subplots(1,1)		# 新建一个画布,一个坐标系
ax.set_title("Test Axes",fontdict={'size':16,'color':'b'}) # 设置一个标题
ax.spines['right'].set_color(None)	# 设置坐标系右边的轴不显示
ax.spines['top'].set_color(None)	# 设置坐标系上面的轴不显示
ax.set_xlim(-5,+5)					# 显示X轴的范围是-5 ~ +5
ax.set_xticks(np.arange(-5,6,1))	# 显示X轴的标记点是[-5,6)左闭右开区间,间隔为1
ax.set_ylim(-20,+20)				# 设置y轴的范围是-20 ~ +20
ax.set_xlabel('X',loc='right')		# 设置x轴的标记为X,位置靠右
ax.set_ylabel('y',loc='top')		# 设置Y轴的标记为Y,位置靠上
ax.spines['bottom'].set_position(('data',0))	# 设置底部的轴在左侧数值轴为0的位置
ax.spines['left'].set_position(('data',0))		# 设置左侧的轴在底部数值轴为0的位置
ax.annotate('$y=2x+5$',xy=(3,16))				# 设置标记
ax.scatter(x=(-5/2),y=0,c='b') # scatter是画一个点,x表示x轴的位置,y表示y轴的位置,c表示颜色
ax.scatter(x=0,y=5,c='b') # scatter是画一个点,x表示x轴的位置,y表示y轴的位置
ax.scatter(x=2,y=9,c='b')
plt.scatter(x=(2,)*10,y=np.linspace(0,9,10),s=1,c='b') # 使用点线画一条虚线
plt.scatter(x=np.linspace(0,2,10),y=(9,)*10,s=1,c='b')
ax.plot(x,y) # plot画一条直线
plt.show()   # 显示图像
如下图所示

附件1 所有配置项
plt.rcParams.keys()
附件2 常用配置项
# 显示中文
plt.rcParams['font.sans-serif'] = 'SimHei'
#设置正常显示字符(负号)
plt.rcParams['axes.unicode_minus'] = False
plt.rcParams['savefig.dpi'] = 300 #图片像素
plt.rcParams['figure.dpi'] = 300 #分辨率
plt.rcParams['figure.figsize'] = (8.0, 4.0)    # 图像显示大小
plt.rcParams['image.interpolation'] = 'nearest' # 最近邻差值: 像素为正方形
#Interpolation/resampling即插值,是一种图像处理方法,它可以为数码图像增加或减少象素的数目。
plt.rcParams['image.cmap'] = 'gray' # 使用灰度输出而不是彩色输出