一. Processing介绍
Processing 是一门开源编程语言和与之配套的集成开发环境(IDE)的名称。Processing 在电子艺术和视觉设计社区被用来教授编程基础,并运用于大量的新媒体和互动艺术作品中。
Processing 最开始的时候只是一门编程语言,因为发展势头好,在2012年的时候成立了Processing 基金会,开始横向拓展其他项目,比如p5.js, Processing的 R 模式等等。
Processing 可以用三个标签来总结:编程,视觉,易学。
简单来说,就是通过写代码来生成图案,用几行简单的代码就可以写出炫酷的视觉效果。
可以免费下载使用,官网:https://processing.org/。单击 Download Processing 并选择您的操作系统,下载安装即可。
Processing 在 2001 年诞生于麻省理工学院(MIT)的媒体实验室,主创者为 Ben Fry 和 Casey Reas,项目发起的初衷,本是为了满足他们自身的教学和学习需要。后来,当Casey在意大利的伊夫雷亚交互设计学院(Interaction Design Institute Ivrea)进行教学的时候,基于Processing,衍生出了Wiring和Arduino项目。随着时间的推移,又诞生了多个语言的版本,比如基于JavaScript的Processing.js,还有基于Python、Ruby、ActionScript以及Scala等版本。
Processing项目是Java开发的,所以Processing天生就具有跨平台的特点,同时支持Linux、Windows以及Mac OSX三大平台,并且支持将图像导出成各种格式。
Processing 是一种具有革命前瞻性的新兴计算机语言,为图像处理提供开源编程语言和环境,动画和互动。这是使用的学生,艺术家,设计师,研究人员和爱好者学习,原型及生产。这是建立基础教育计算机编程在视觉方面,并作为软件写生簿和专业的生产工具。Processing 开发的艺术家和设计师以替代专有软件工具在同一域中。
二. 基于Python案例
2.1 绘制正方形
ellipse(50, 50, 80, 80)
执行结果如下:

2.2 背景和颜色
background 功能被用来设置显示窗口的颜色。此函数可以使用各种不同的参数(来定义一个灰度值或 Red-Green-Blue [RGB] 颜色)。
size(100, 100)
background( 0, 128, 0 )
执行结果如下图:

2.3 鼠标控制箭头
#arrow.pyde

def setup():
    size(600,600)

cols = 20 #number of columns
#scale factors:
xscl = 600/cols
yscl = 600/cols
sz = 6

def draw():
    global cols, xscl, yscl
    background(255)
    for x in range(cols):
        for y in range(cols):
            arrow(10+x*xscl,10+y*yscl,sz)

def arrow(x,y,sz):
    pushMatrix()
    translate(x,y)
    angle = atan2(mouseY-y,mouseX-x)
    rotate(angle)
    beginShape()
    vertex(0,-sz/2.0)
    vertex(2*sz,-sz/2.0)
    vertex(2*sz,-3*sz/2.0)
    vertex(4*sz,0)
    vertex(2*sz,3*sz/2.0)
    vertex(2*sz,sz/2.0)
    vertex(0,sz/2.0)
    endShape(CLOSE)
    popMatrix()

2.4 正方向四周扩散
GRID_W = 41
GRID_H = 41

generation = 0

class Cell:
    def __init__(self,r,c,on=0):
        self.c = c
        self.r = r
        self.on = on

    def display(self):
        if self.on == 1:
            fill(0) #black
        else:
            fill(255) #white
        rect(SZ*self.r, SZ*self.c, SZ, SZ)

    def checkNeighbors(self):
        neighbs = 0  #check the neighbors
        if self.on == 1: return 1
        for dr,dc in [[-1,0], [1,0], [0,-1],[0,1]]:
            try:
                if cellList[self.r + dr][self.c + dc].on == 1:
                    neighbs += 1
            except IndexError:
                continue
        if neighbs in [1,4]:
            return 1
        else:
            return 0


def setup():
    global SZ, cellList
    noStroke()
    size(600,600)
    SZ = width // GRID_W + 1
    cellList = createCellList()

def draw():
    global generation,cellList
    frameRate(10)
    cellList = update(cellList)
    for row in cellList:
        for cell in row:
            cell.display()
    generation += 1
    if generation == 30:
        generation = 1
        cellList = createCellList()
        loop()

def update(cellList):
    newList = []
    for r,row in enumerate(cellList):
        newList.append([])
        for c,cell in enumerate(row):
            newList[r].append(Cell(r,c,cell.checkNeighbors()))
    return newList[::]


def createCellList():
    '''Creates a big list of off cells with
    one on Cell in the center '''
    newList=[]#empty list for cells
    #populate the initial cell list
    for j in range(GRID_H):
        newList.append([]) #add empty row
        for i in range(GRID_W):
            newList [j].append(Cell(i,j,0)) #add off Cells or zeroes
    #center cell is set to on
    newList [GRID_H//2][GRID_W//2].on = 1
    return newList
执行结果如下:

2.5 红色圆圈
def setup():
    size(600,600)

def draw():
    background(255)
    translate(width/2,height/2)
    points = []
    num = 24
    for i in range(num):
        x = 250*cos(radians(360.0*i/num))
        y = 250*sin(radians(360.0*i/num))
        #put point in a list
        points.append([x,y])

    for p in points: #from every point
        for other in points: #to every "other" point
            stroke(255,0,0) #red
            line(p[0],p[1],other[0],other[1])
执行结果如下图:

2.6 绘制正弦曲线
#CircleSineWave.pyde
r1 = 100 #radius of big circle
r2 = 10  #radius of small circle
t = 0 #time variable
circleList = []

def setup():
    size(600,600)

def draw():
    global t, circleList
    background(200)
    #move to left-center of screen
    translate(width/4,height/2)
    noFill() #don't color in the circle
    stroke(0) #black outline
    ellipse(0,0,2*r1,2*r1)

    #circling ellipse:
    fill(255,0,0) #red
    y = r1*sin(t)
    x = r1*cos(t)
    #add point to list:
    circleList.insert(0,y)
    ellipse(x,y,r2,r2)
    stroke(0,255,0) #green for the line
    line(x,y,200,y)
    fill(0,255,0) #green for the ellipse
    ellipse(200,y,10,10)

    if len(circleList)>300:
        circleList.remove(circleList[-1])


    #loop over circleList to leave a trail:
    for i,c in enumerate(circleList):
        #small circle for trail:
        ellipse(200+i,c,5,5)

    t += 0.05
执行结果如下图:

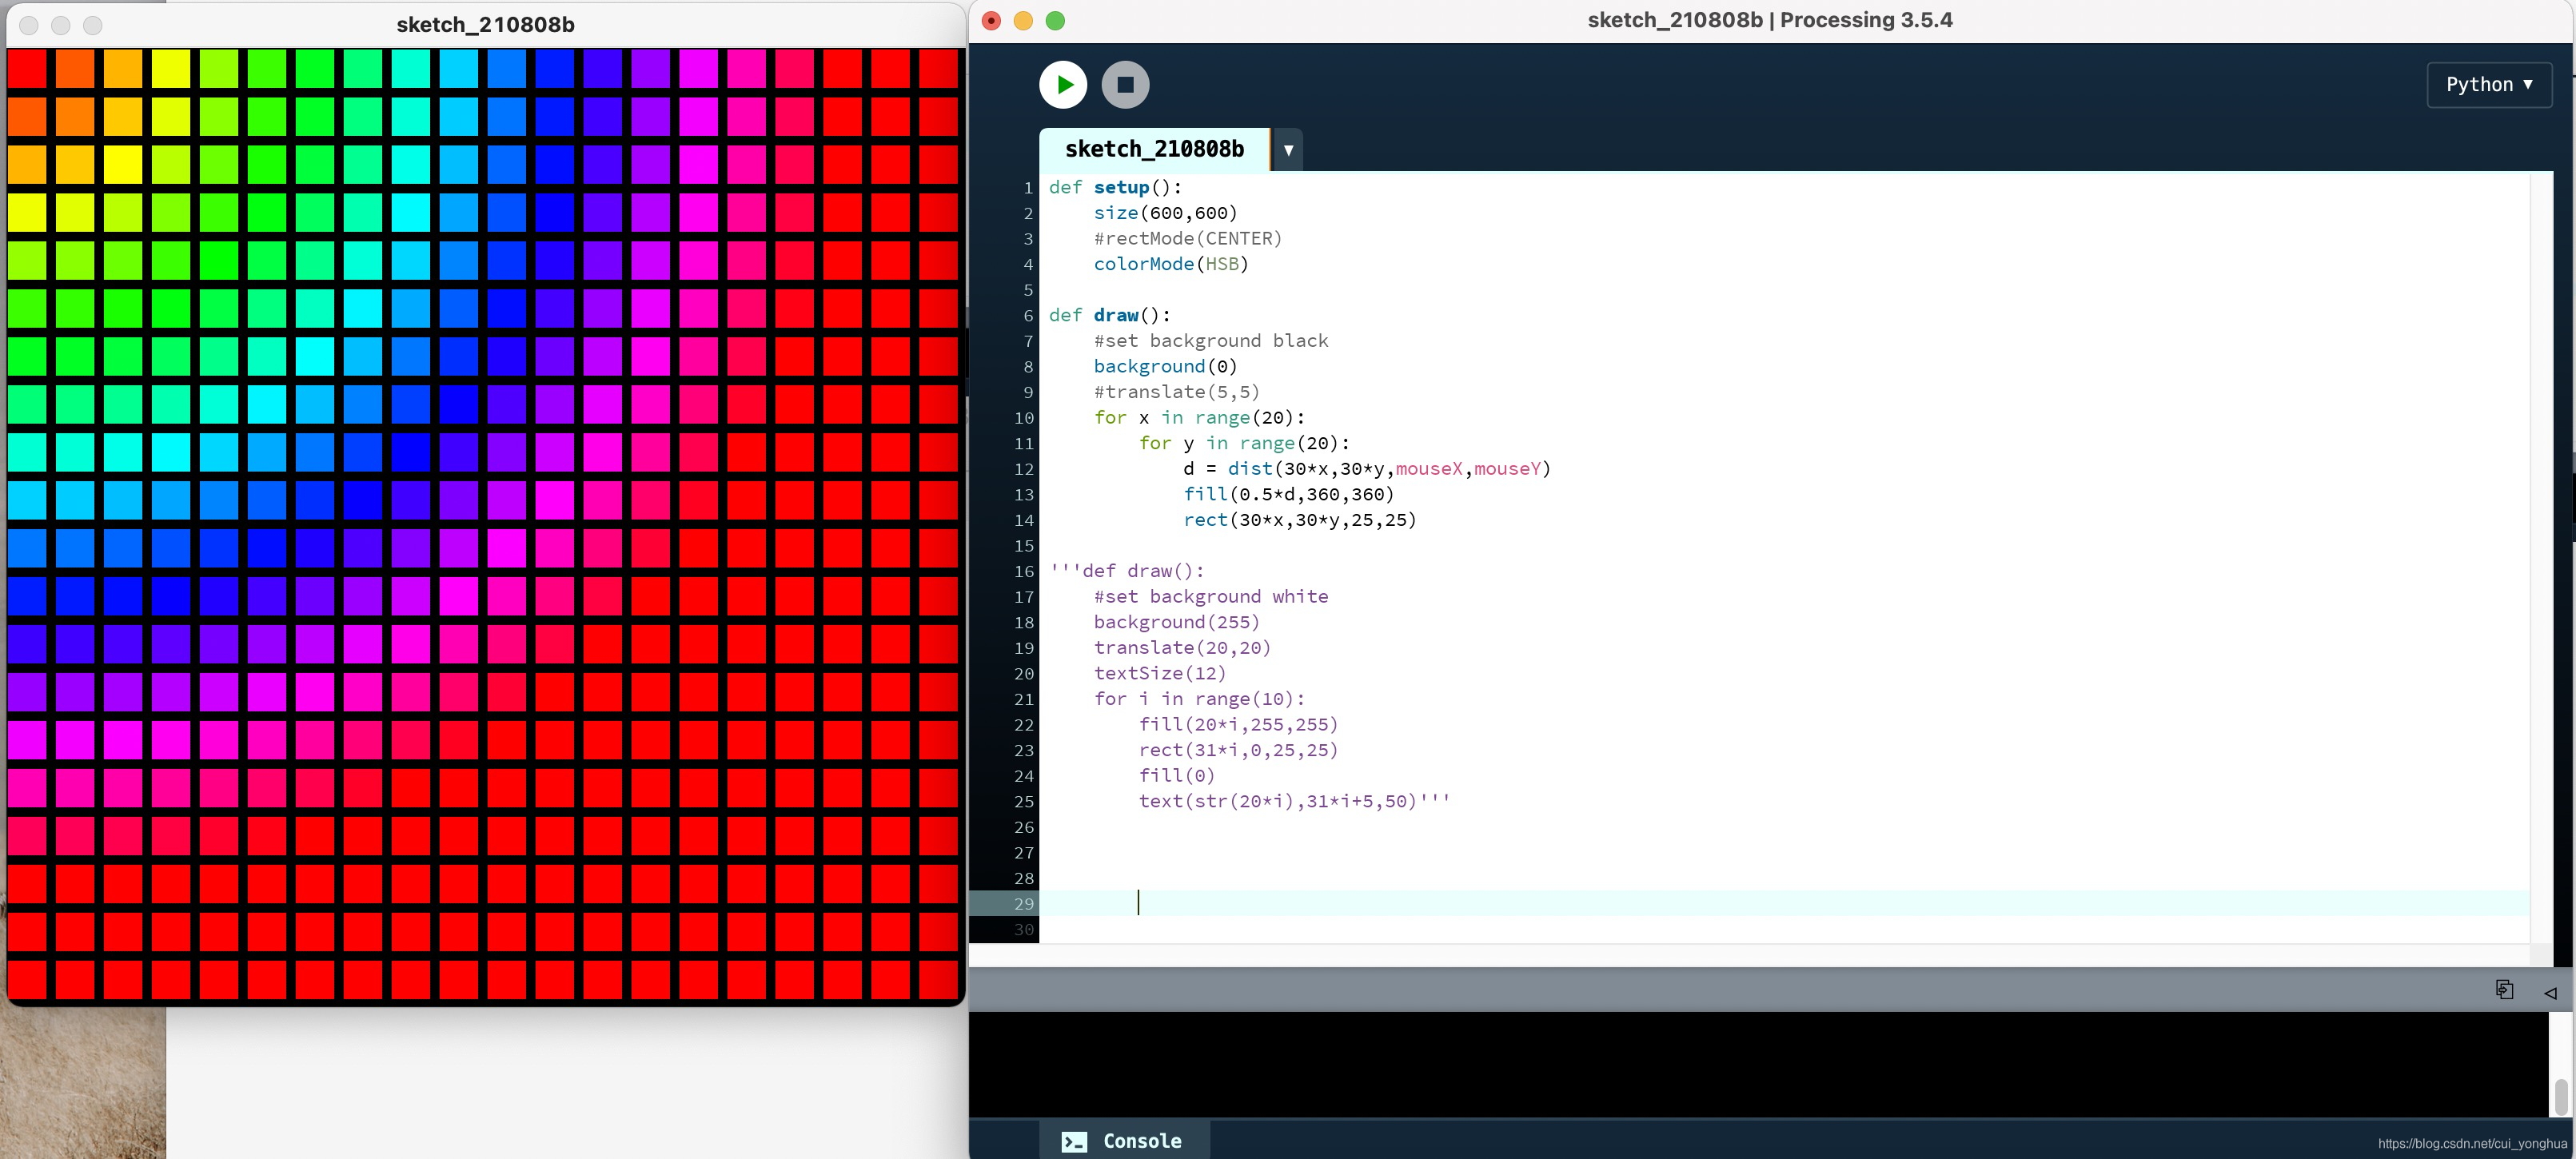
2.7 生成各种颜色
def setup():
    size(600,600)
    #rectMode(CENTER)
    colorMode(HSB)

def draw():
    #set background black
    background(0)
    #translate(5,5)
    for x in range(20):
        for y in range(20):
            d = dist(30*x,30*y,mouseX,mouseY)
            fill(0.5*d,360,360)
            rect(30*x,30*y,25,25)

'''def draw():
    #set background white
    background(255)
    translate(20,20)
    textSize(12)
    for i in range(10):
        fill(20*i,255,255)
        rect(31*i,0,25,25)
        fill(0)
        text(str(20*i),31*i+5,50)'''
执行结果如下:

2.8 绘制滚动的圆
t = 0.0 #time
dt = 0.01 #change in time
r = 50 #radius of circle
ground = 250 # y-val of line circle rolls on
x,Y = 0,ground-r #initial location of circle
v = 2.0 #horizontal velocity factor of circle
points = [] #list to store points

def setup():
    size(942,300)

def draw():
    global t,dt,r,ground,x,y,points
    background(255) #white
    strokeWeight(2)
    stroke(150)
    line(0,ground,width,ground) #line for the "ground"
    noFill()
    ellipse(x,Y,2*r,2*r)
    #calculate position of drawing "dot"
    dot = PVector(x+r*cos(v*TWO_PI*t+PI/2),Y+r*sin(TWO_PI*v*t+PI/2))
    #save that position to the points list, to be drawn later
    points.append(dot)
    line(dot.x,dot.y,x,Y) #radial segment
    fill(255,0,0) #red dot
    ellipse(dot.x,dot.y,10,10)
    #loop through the points list to draw the curve
    for i,pt in enumerate(points):
        if i < len(points) - 2:
            stroke(255,0,0)
            line(pt.x,pt.y,points[i+1].x,points[i+1].y)
    x += TWO_PI*r*dt*v #update x-value by velocity
    if x > width: #when the wheel gets all the way to the right
        #noLoop() # uncomment this out to only run it once
        x = 0.0 # reset position all the way to the left
        points = [] # erase the trail
    #println(x) #just for testing
    #println(dot.x)
    t += dt #increment the time variable
执行结果如下

2.9 黑色背景白点圆
def setup():
    size(600,600)

def draw():
    background(0)
    translate(width/2, height/2)
    for i in range(12):
        ellipse(200,20,15,15)
        rotate(radians(360/12))
执行结果如下:

2. 10 无限圆圈放大
'''Web/Vortex of Circles
June 14, 2018'''

factor = 1.3

def setup():
    size(600,600)
    noFill()
    stroke(255) #white lines

def draw():
    global factor
    background(0)
    #Uncomment to display the value of factor
    '''fill(255,0,0)
    textSize(18)
    text(factor,20,20)'''
    factor -= 0.005
    #move the mouse to vary the factor
    #factor = map(mouseX,0,255,1,1.5)
    translate(width/2,height/2)
    vortex(500,100)
    #uncomment these lines to save screenshots:
    '''saveFrame('####.png')'''
    if factor <= 1.07:
        factor = 1.3 #noLoop() #will stop the loop

def vortex(r,level):
    num = 30 #number of circles in one ring
    if level > 0:
        r2 = r/4.0
        for i in range(num):
            pushMatrix()
            rotate(radians(360*i/float(num)))
            translate(r,0)
            st = map(r2,0,100,0,3) #make strokeWeight vary
            strokeWeight(st)
            noFill()
            ellipse(0,0,r2,r2)
            popMatrix()
        rotate(TWO_PI/(2*num))


        vortex(r/factor,level-1)#1.065,level-1)
