这里写目录标题
1 创建读取数据
# 1 数据读取和预处理
df = pd.read_csv(r"F:\gongsi\WorkList\1工作文档\时空聚类数据集\洛杉矶犯罪数据集\Crime_Data_from_2020_to_Present.csv")
df_quNAN = df[df['LAT']>0]                                         # 去0值
date_y2020 = df_quNAN[df_quNAN["DATE OCC"].str.contains("/2020")]  # 2020年数据
date_y2020 = df_quNAN[df_quNAN["DATE OCC"].str.contains("/2020")]       # 取出2020年的数据
date_y2020month = date_y2020[date_y2020["DATE OCC"].str.startswith('01')]   # 取出1月份的数据   (18145, 28)
kongjian_y2020month = date_y2020month.loc[:,['LAT','LON']]             # 只获取3列的数据  (18145, 3)
kongjian_y2020month['cluster'] = cluster.labels_

# 字段名和索引的实现
kongjian_y2020month.columns = ['latitude', 'longitude']   # 因为空间聚类算法用到'latitude', 'longitude'属性
kongjian_y2020month.index = range(len(kongjian_y2020month))
2 查看数据
(1)查看列
date_y2020.columns
(2)date_y2020.infos()
(3)df.describe()
(4)df.head(10)
(5)df.shape
(6)df[‘LAT’].dtypes # 查看某一列的类型
(7)date_y2020month[‘Crm Cd’].value_counts().keys
( 8)查看值分布
kongjian_y2020month['cluster'] = cluster.labels_
kongjian_y2020month['cluster'].value_counts().values
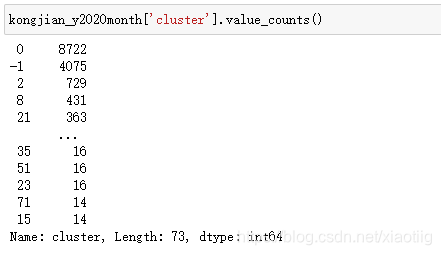
kongjian_y2020month['cluster'].value_counts()


(9)查看每个值的分布
for item in date_y2020month['Premis Cd'].value_counts().keys():
    print(item)
    plt.figure(figsize=(12, 9), dpi=80)  # 绘图
    plt.scatter(date_y2020month[date_y2020month['Premis Cd'] == item]['LON'].values.tolist(),
                date_y2020month[date_y2020month['Premis Cd'] == item]['LAT'].values.tolist())
    plt.show()
(10)查看以6开头的值的分布
list(date_y2020jan1[(date_y2020jan1['Crm Cd'] / 100).astype(int) == 6]['Crm Cd Desc'].values)
(11)查看每种类型的值的个数

(12)查看最大最小值唯一值
print(df["date_time"].min())
df["month"].unique()
(13)查看空值分布
kongjian_y2020jan.isnull().sum([kongjian_y2020jan.isnull().sum()>0]
(14)柱状图查看

(15)统计数据查看

3 获取指定行列数据
3.1 查询选择
https://blog.csdn.net/weixin_29696999/article/details/112663789
pandas读取行列数据的所有方法
https://www.cnblogs.com/wynlfd/p/14024947.html
一共3种:
用loc和iloc可以解决所有问题了
(1) 获取指定行名和列名用loc
(2) 获取指定列的所有行用df[[‘省份’, ‘总人数’]],不推荐用它
df[‘省份’]) #按列名取列
df.省份) # 按列名取列
(3) 根据位置索引用iloc
3.2 根据条件筛选

https://www.pythonf.cn/read/157986
3.3 数据格式转换
y2020jan['Premis Cd'] = (y2020jan['Premis Cd']/100).astype(int)
3.4 数据统计
x_label = y2020jan1[y2020jan1['cluster_num']==3].groupby('AREA').size().keys().values
y_label = y2020jan1[y2020jan1['cluster_num']==3].groupby('AREA').size().values
plt.bar(x_label,y_label)
plt.show()
4 时间数据
这个最好
https://blog.csdn.net/weixin_41261833/article/details/104839119
https://www.cnblogs.com/shao-shuai/p/9839011.html
https://www.cnblogs.com/zhangyafei/p/10513893.html
4.1 提取年月日时间
df["date_"] = pd.to_datetime(df['date'])          # 1 日期转换为时间格式
print(df["date_"].value_counts().values)                 # 2 查看每天的数据
df["date_time"] = pd.to_datetime(df['date'] + ' ' + df['time'])        # 3 将日期列和时间列的字符串合并,并转为datetime格式
df["date_time_beijing"] =  df["date_time"] +datetime.timedelta(hours=8)      # 4 将时间加上8小时
df["year"] = df['date_time_beijing'].apply(lambda x:x.year)           # 5 获取年份
df["month"] = df['date_time_beijing'].apply(lambda x:x.month)         # 6 获取月份
df["day"] = df['date_time_beijing'].apply(lambda x:x.day)
print("最小时间:",df["date_time_beijing"].min())                           # 7查看时间范围最大最小
print(df["date_time_beijing"].max())
df["weekday"] = df['date_time_beijing'].apply(lambda x:x.dayofweek)    # 8 获取星期,0代表星期1,1代表星期2
df["hour"] =  df['date_time_beijing'].apply(lambda x:x.hour)           # 9 获取小时
df_min = df.iloc[::12, :]               # 10 1分钟取一条
apple = apple.set_index("Date")  # 将时间设为索引
4.2 提取时间time,不要date
# 这种提取时间的方式不对,不知道为什么,只能用下面的方式
df["time"] = df['date_time_beijing'].apply(lambda x:x.time)

字符串和datetime之间的转换https://blog.csdn.net/xiaomeng29/article/details/91366762

5 数据操作(加减乘除)


归一化
max_min_scaler = lambda x : (x-numpy.min(x))/(numpy.max(x)-numpy.min(x))    # 9 对连续变量进行归一化
kkk = y2020jan[['Vict Age']].apply(max_min_scaler)
类型转换
y2020jan['Crm Cd'] = y2020jan['Crm Cd'].astype(str)            # 10 进行类型转换,转为one hot编码,先转换为object才行,否则不会转换
y2020jan['Premis Cd'] = y2020jan['Premis Cd'].astype(int)
将一列数对应改成其它名称,先变成字典,再一一对应
y2020jan_result = y2020jan['Vict Descent'].unique()           # 9 Vict Descent变成数字类型
y2020jan_result = y2020jan_result.tolist()
list_vict = list(range(len(y2020jan_result)))
Vict_Descent_dict = dict(zip(y2020jan_result,list_vict))
Vict_Descent_dict
y2020jan['Vict Descent'] = y2020jan['Vict Descent'].map(Vict_Descent_dict)   # 9 Vict Descent变成数字类型


除以100只保留百位数字
y2020jan['Crm Cd'] = (y2020jan['Crm Cd']/100).astype(int)                     # 10 只保留首位数字代码
y2020jan['Premis Cd'] = (y2020jan['Premis Cd']/100).astype(int)
y2020jan['Weapon Used Cd'] = (y2020jan['Weapon Used Cd']/100).astype(int)
y2020jan

6 评价指标
print("calinski_harabasz_score:",calinski_harabasz_score(kongjian_y2020month[['LON', 'LAT']],cluster.labels_,metric=customer_metric))
print("silhouette_score:", silhouette_score(kongjian_y2020month[['LAT','LON']], cluster.labels_,metric=customer_metric))
7 可视化探索
plt.figure(figsize=(12, 9), dpi=80)  # 绘图
plt.scatter(kongjian_y2020month['LON'].values.tolist(), kongjian_y2020month['LAT'].values.tolist(),c=cluster.labels_)
plt.title('SPACE-DBSCAN: 2020-01:eps=500,min_samples=%d' % item)
plt.xlabel('longitude(W)')
plt.ylabel('latitude(N)')
plt.savefig("F:/gongsi/WorkList/6canshu/2dbscan_min/SpaceDbscan202001min%d.png" % item, dpi=300)
plt.show()
plt.cla()
进行图例的划分
fig, ax1 = plt.subplots(figsize=(12, 9), dpi=80)
ax1.scatter(y2020jan_k0['LAT'].values.tolist(),y2020jan_k0['LON'].values.tolist(), c = 'red',label = 'class1')
ax1.scatter(y2020jan_k1['LAT'].values.tolist(),y2020jan_k1['LON'].values.tolist(), c = 'purple',label = 'class2')
ax1.scatter(y2020jan_k2['LAT'].values.tolist(),y2020jan_k2['LON'].values.tolist(), c = 'blue',label = 'class3')
ax1.scatter(y2020jan_k3['LAT'].values.tolist(),y2020jan_k3['LON'].values.tolist(), c = 'pink',label = 'class4')
ax1.scatter(y2020jan_k4['LAT'].values.tolist(),y2020jan_k4['LON'].values.tolist(), c = 'green',label = 'class5')
ax1.scatter(y2020jan_k5['LAT'].values.tolist(),y2020jan_k5['LON'].values.tolist(), c = 'yellow',label = 'class6')

plt.legend()

plt.show()
显示中文
https://blog.csdn.net/asialee_bird/article/details/81027488
from matplotlib.font_manager import FontProperties #字体管理器
#设置汉字格式
font = FontProperties(fname=r"c:\windows\fonts\simsun.ttc", size=15)
fig, ax1 = plt.subplots(figsize=(12, 9), dpi=80)
ax1.scatter(zaoshengdian['LON'].values.tolist(),zaoshengdian['LAT'].values.tolist(), c = 'red',)
ax1.scatter(redian['LON'].values.tolist(),redian['LAT'].values.tolist(), c = 'purple',label = '高犯罪率地区',)
plt.legend(prop=font)
plt.title('洛杉矶2020年1月份犯罪热点区域',fontproperties=font)
plt.xlabel('longitude(W)')
plt.ylabel('latitude(N)')
plt.show()
加载地图
import folium
latitude = 34.0677
longitude = -118.2398
san_map = folium.Map(location=[latitude, longitude], zoom_start=12)

from geopy.distance import great_circle
import pandas as pd
from sklearn.cluster import DBSCAN

# 1 数据读取和预处理
df = pd.read_csv(r"F:\gongsi\WorkList\1工作文档\时空聚类数据集\洛杉矶犯罪数据集\Crime_Data_from_2020_to_Present.csv")
df_quNAN = df[df['LAT']>0]                                         # 去0值
date_y2020 = df_quNAN[df_quNAN["DATE OCC"].str.contains("/2020")]  # 2020年数据
date_y2020month = date_y2020[date_y2020["DATE OCC"].str.startswith('12')]   # 取出1月份的数据   (18145, 28)
kongjian_y2020month = date_y2020month.loc[:,['LAT','LON']]             # 只获取3列的数据  (18145, 3)
def customer_metric(x ,y):
    """
    计算空间距离
    :param x: 一个点
    :param y: 另一个点
    :return: 返回距离
    """
    return great_circle(x,y).meters

dbscan = DBSCAN(eps=500, min_samples=60, metric=customer_metric)  # 实例
# 必须是维度和经度
cluster = dbscan.fit(kongjian_y2020month[['LAT', 'LON']])
kongjian_y2020month['cluster'] = cluster.labels_

redian = kongjian_y2020month[kongjian_y2020month['cluster']!=-1]
zaoshengdian =  kongjian_y2020month[kongjian_y2020month['cluster']==-1]

data = redian.iloc[:, :2]
incidents = folium.map.FeatureGroup()
for lat, lng, in zip(data.LAT, data.LON):
    incidents.add_child(
        folium.CircleMarker(
            [lat, lng],
            radius=4, # define how big you want the circle markers to be
            color='yellow',
            fill=True,
            fill_color='red',
            fill_opacity=0.4
        )
    )

# Add incidents to map
san_map = folium.Map(location=[latitude, longitude], zoom_start=12)
san_map.add_child(incidents)
8 模型构建
9 其它
9.1 自定义距离
def customer_metric(x ,y):
    """
    计算空间距离
    :param x: 一个点
    :param y: 另一个点
    :return: 返回距离
    """
    return great_circle(x,y).meters

dbscan = DBSCAN(eps=500, min_samples=30, metric=customer_metric)  # 实例
探索距离
from scipy.spatial.distance import pdist
x = np.array([[ 0, 2, 3, 4],
[ 2, 0, 7, 8],
[ 3, 7, 0, 12],
[ 4, 8, 12, 0]])
distance = pdist(x, metric=‘euclidean’) # 求出来两两向量的距离
low, mid, up = np.percentile(distance, [25, 50, 75]) # 对距离求解分位数
eps = mid + 1.5*(up- low) # 选择盒图的上界作为邻域半径的选择
eps
9.2 设置参数
案例:
from geopy.distance import great_circle
import pandas as pd
from sklearn.cluster import DBSCAN
from sklearn import datasets
import numpy as np
import random
import matplotlib.pyplot as plt
import time

# 聚类评价指标
from sklearn.metrics import calinski_harabasz_score,silhouette_score
# score = calinski_harabasz_score(kongjian_y2020jan_sample[['latitude','longitude']], kongjian_y2020jan_sample['clusters'])
begin = time.time()

# 1 数据读取和预处理
df = pd.read_csv(r"F:\gongsi\WorkList\1工作文档\时空聚类数据集\洛杉矶犯罪数据集\Crime_Data_from_2020_to_Present.csv")
df_quNAN = df[df['LAT']>0]                                         # 去0值
date_y2020 = df_quNAN[df_quNAN["DATE OCC"].str.contains("/2020")]  # 2020年数据
date_y2020month = date_y2020[date_y2020["DATE OCC"].str.startswith('01')]   # 取出1月份的数据   (18145, 28)
kongjian_y2020month = date_y2020month.loc[:,['LAT','LON']]             # 只获取3列的数据  (18145, 3)

def customer_metric(x ,y):
    """
    计算空间距离
    :param x: 一个点
    :param y: 另一个点
    :return: 返回距离
    """
    return great_circle(x,y).meters

dbscan = DBSCAN(eps=500, min_samples=60, metric=customer_metric)  # 实例
# 必须是维度和经度
cluster = dbscan.fit(kongjian_y2020month[['LAT', 'LON']])
kongjian_y2020month['cluster'] = cluster.labels_
kongjian_y2020month.describe()

redian = kongjian_y2020month[kongjian_y2020month['cluster']!=-1]
zaoshengdian =  kongjian_y2020month[kongjian_y2020month['cluster']==-1]

from matplotlib.font_manager import FontProperties #字体管理器
#设置汉字格式
font = FontProperties(fname=r"c:\windows\fonts\simsun.ttc", size=15)
fig, ax1 = plt.subplots(figsize=(12, 9), dpi=80)
ax1.scatter(zaoshengdian['LON'].values.tolist(),zaoshengdian['LAT'].values.tolist(), c='purple')
ax1.scatter(redian['LON'].values.tolist(),redian['LAT'].values.tolist(), c = 'r',label = '高犯罪率区域',)
plt.legend(prop=font)
plt.title('洛杉矶2020年1月份犯罪热点区域',fontproperties=font)
plt.xlabel('longitude(W)')
plt.ylabel('latitude(N)')
plt.show()