Clark变换
作用
参考:
https://blog.csdn.net/chenjianbo88/article/details/53027298
https://zhuanlan.zhihu.com/p/147659820

将 平面三相坐标系
I
a
I
b
I
c
I_aI_bI_c
Ia?Ib?Ic? 变换为 平面直角坐标系
I
α
I_\alpha
Iα?
I
β
I_\beta
Iβ?
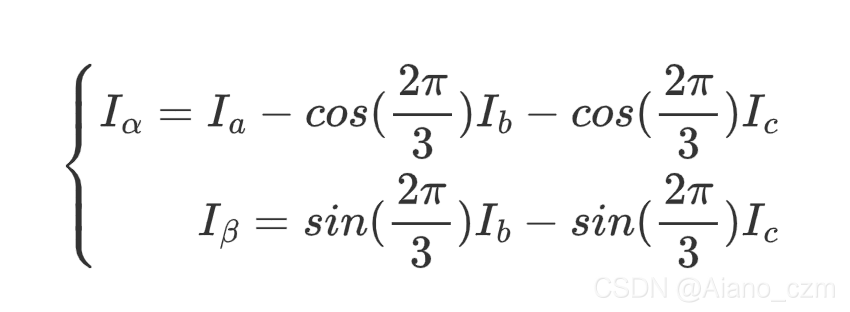
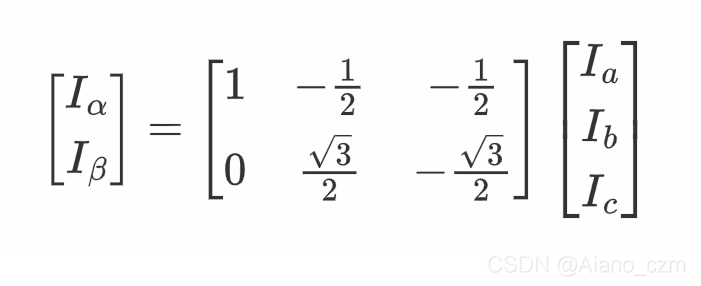
写成矩阵:
Python模拟
sin函数:https://blog.csdn.net/henni_719/article/details/77367294
正弦波信号:https://blog.csdn.net/weixin_39124421/article/details/103817951
np.linspace():https://blog.csdn.net/Asher117/article/details/87855493
import numpy as np
import matplotlib.pyplot as plt


def clark_transformation(input_matrix):
    trans_arr = np.mat([[1, -1 / 2, -1 / 2], [0, np.sqrt(3) / 2, -np.sqrt(3) / 2]])
    return trans_arr * input_matrix


def show_plot():
    # init
    plt.figure(figsize=(50,10))

    # process
    lin = np.linspace(0, 50, num=1000)
    print(lin)
    sin_wave1 = np.sin(lin)
    phi = np.pi * 2 / 3
    sin_wave2 = np.sin(lin - phi)
    sin_wave3 = np.sin(lin - phi * 2)

    # draw
    plt.subplot(211)
    plt.grid()
    plt.title('Source')
    plt.plot(lin, sin_wave1)
    plt.plot(lin, sin_wave2)
    plt.plot(lin, sin_wave3)

    # clark transformation
    trans_wave1 = np.empty(lin.shape)
    trans_wave2 = np.empty(lin.shape)
    for i in range(len(lin)):
        input_array = np.mat([[sin_wave1[i]], [sin_wave2[i]], [sin_wave3[i]]])
        output_array = clark_transformation(input_array)
        trans_wave1[i] = output_array[0]
        trans_wave2[i] = output_array[1]

    # draw
    plt.subplot(212)
    plt.grid()
    plt.title('Trans')
    plt.plot(lin, trans_wave1)
    plt.plot(lin, trans_wave2)

    plt.show()


show_plot()
效果:

上图为相位相差 2 π 3 \frac{2\pi}{3} 32π?的三个正弦波
下图为经过Clark变换得到的两个正弦波
Park变换
作用
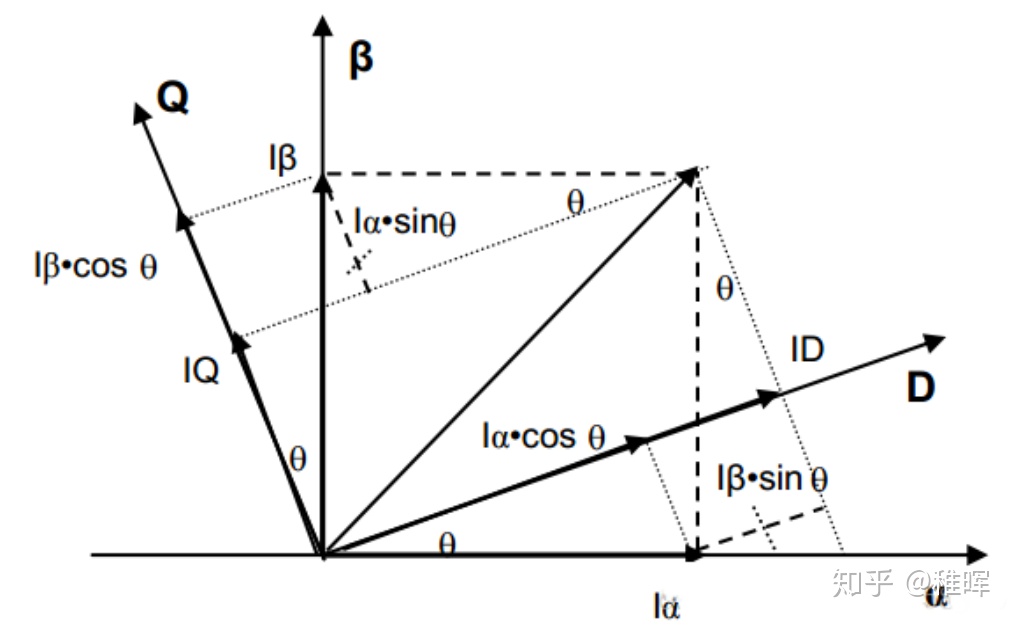
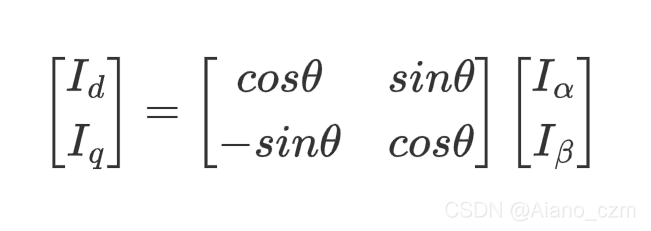
让新的坐标系跟着theta角旋转,使得投影到该坐标系上的值为定值,达到让非线性线性化的效果
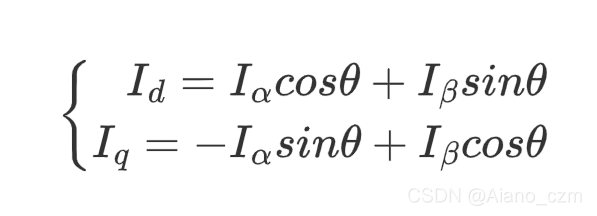
写成矩阵:(其实就是一个旋转矩阵)
Python模拟
import numpy as np
import matplotlib.pyplot as plt


def clark_transformation(input_matrix):
    trans_arr = np.mat([[1, -1 / 2, -1 / 2], [0, np.sqrt(3) / 2, -np.sqrt(3) / 2]])
    return trans_arr * input_matrix


def park_transformation(input_matrix, theta):
    trans_arr = np.mat([[np.cos(theta), np.sin(theta)], [-np.sin(theta), np.cos(theta)]])
    return trans_arr * input_matrix


def show_plot():
    # init
    plt.figure(figsize=(20, 10))

    # process
    lin = np.linspace(0, 50, num=1000)
    print(lin)
    sin_wave1 = np.sin(lin)
    phi = np.pi * 2 / 3
    sin_wave2 = np.sin(lin - phi)
    sin_wave3 = np.sin(lin - phi * 2)

    # draw1
    plt.subplot(311)
    plt.grid()
    plt.title('Source')
    plt.plot(lin, sin_wave1)
    plt.plot(lin, sin_wave2)
    plt.plot(lin, sin_wave3)

    # clark transformation
    clark_trans_wave1 = np.empty(lin.shape)
    clark_trans_wave2 = np.empty(lin.shape)
    for i in range(len(lin)):  # i means index, lin[i] means theta
        input_array = np.mat([[sin_wave1[i]],
                              [sin_wave2[i]],
                              [sin_wave3[i]]])
        output_array = clark_transformation(input_array)
        clark_trans_wave1[i] = output_array[0]
        clark_trans_wave2[i] = output_array[1]

    # draw2
    plt.subplot(312)
    plt.grid()
    plt.title('Clark')
    plt.plot(lin, clark_trans_wave1)
    plt.plot(lin, clark_trans_wave2)

    # park transformation
    park_trans_wave1 = np.empty(lin.shape)
    park_trans_wave2 = np.empty(lin.shape)
    for i in range(len(lin)):  # i means index, lin[i] means theta
        input_array = np.mat([[clark_trans_wave1[i]],
                              [clark_trans_wave2[i]]])
        output_array = park_transformation(input_array, lin[i])
        park_trans_wave1[i] = output_array[0]
        park_trans_wave2[i] = output_array[1]

    # draw3
    plt.subplot(313)
    plt.grid()
    plt.title('Park')
    plt.plot(lin, park_trans_wave1)
    plt.plot(lin, park_trans_wave2)

    # show plot
    plt.show()


show_plot()
效果:
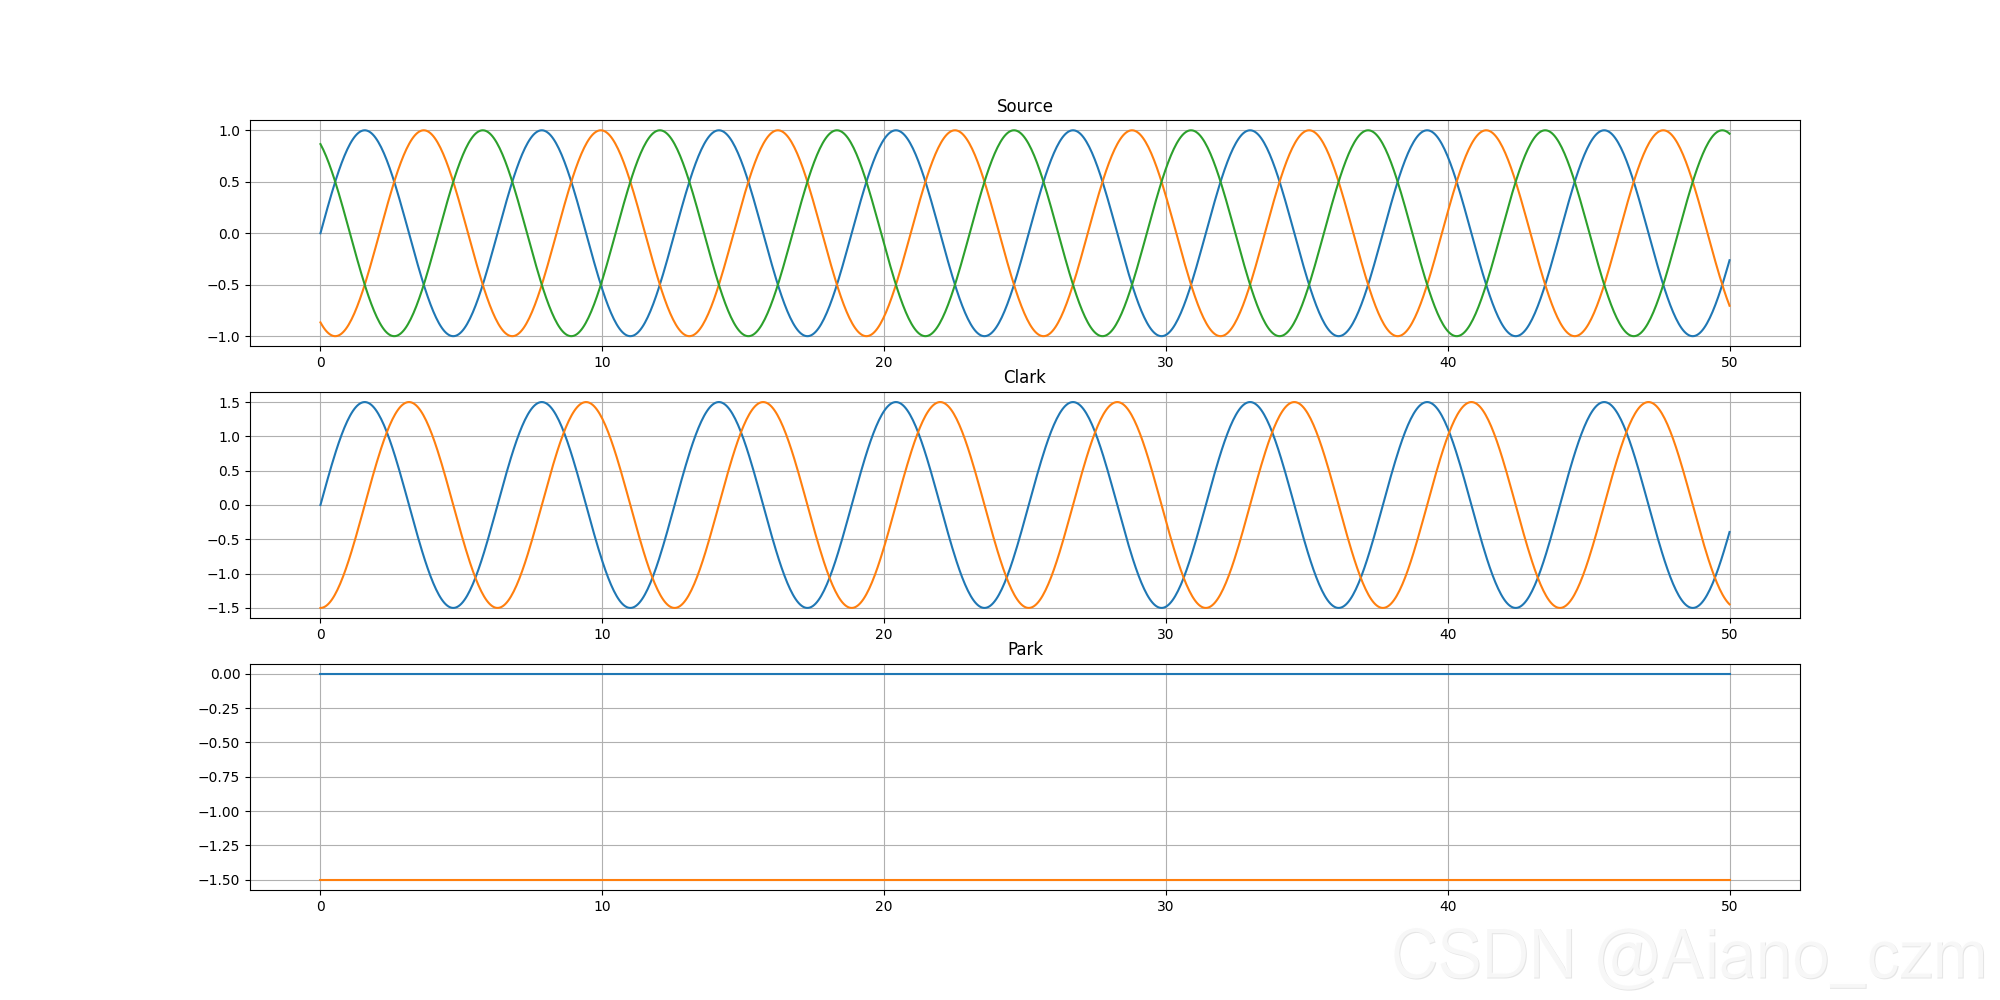
我是顺着Clark变换接着变换的,可以看出最终都是一条直线,是常量