Python Matplotlib绘图的正确打开方式
文章目录
Python是一个非常容易手的语言,相比与MATLAB,Python在数据预处理上简单易用,很多功能强大的库(例如Pandas、Numpy etc.)可以帮助我们非常轻松的进行数据的预处理,可以很好帮助我们在论文写作中的数据处理与分析工作。
-刚开始使用python绘图经常陷入一个误区,刚开始,找几个教程,plt.*** 一顿写。画完了。遇到坐标啊之类的细节不会调?然后问题出现了,matplotlib最烦人的地方就是,同样一个目标,你可以有N种不同的方法去实现他。比如说哦,加标题:plt.set_title() 可以吧。ax.title.set_text(‘title’) 也可以吧。ax.set_title()也可以啊。所以到底要用哪个??
当你在网上搜索答案的时候,你会遇到各种实现的方法,如果你只是单纯的把找到的答案copypaste,那总有一天你会和我一样崩溃。所以这份指南是用来(尝试)解决这个问题的。我们花短短的时间,来从根本上了解一下matplotlib的架构,各种名词是什么意思,一个正常的画图程序是什么。
1.先搞懂fig、axes、axis
matplotlib有大量的代码库,可能会让许多新用户望而生畏。然而,matplotlib的大部分内容都可以通过相当简单的概念框架和几个要点的知识来理解。绘图需要在一系列关卡中进行操作,从最一般的(例如,“勾画出这个二维数组的轮廓”)到最具体的(例如,“将这个屏幕涂成像素红色”)。绘图包的目的是帮助您尽可能轻松地可视化您的数据,并提供所有必要的控制——也就是说,通过在大多数情况下使用相对高级的命令,并且在需要时仍然能够使用低级命令。因此,matplotlib中的一切都是按层次结构组织的。层次结构的顶部是ma提供的matplotlib“状态机环境”
首先,我们先看看绘图时的各个主要构成元素,从本质上去理解plt.*与ax.*的区别是什么,只有弄懂了这个最后我们才不至于被这个相似又有所不同的方法的区别。(点击)

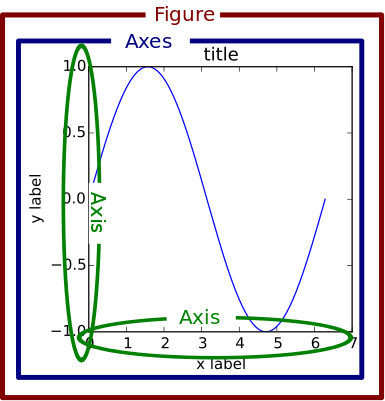
Figure
The whole figure. The figure keeps track of all the child Axes、少量“特殊”artist如标题、图形图例等)和画布。(不要太担心画布,它是至关重要的,因为它是实际绘制你的情节的对象,但作为用户,它或多或少对你是不可见的)。一个图形可以包含任意数量的 Axes,但通常至少有一个。
创建新图形最简单的方法是使用pyplot:
fig = plt.figure()  # an empty figure with no Axes
fig, ax = plt.subplots()  # a figure with a single Axes
fig, axs = plt.subplots(2, 2)  # a figure with a 2x2 grid of Axes
Axes
This is what you think of as ‘a plot’, it is the region of the image with the data space. A given figure can contain many Axes, but a given Axes object can only be in one Figure. The Axes contains two (or three in the case of 3D) Axis objects (be aware of the difference between Axes and Axis) which take care of the data limits (the data limits can also be controlled via the axes.Axes.set_xlim() and axes.Axes.set_ylim() methods). Each Axes has a title (set via set_title()), an x-label (set via set_xlabel()), and a y-label set via set_ylabel()).
The Axes class and its member functions are the primary entry point to working with the OO interface.
Axis
These are the number-line-like objects. They take care of setting the graph limits and generating the ticks (the marks on the axis) and ticklabels (strings labeling the ticks). The location of the ticks is determined by a Locator object and the ticklabel strings are formatted by a Formatter. The combination of the correct Locator and Formatter gives very fine control over the tick locations and labels.
Artist
基本上你在图上看到的所有东西都是Artist(甚至是 the Figure, Axes, Axis对象)。这包括 Text objects, Line2D objects, collections objects, Patch objects 。当图形被渲染时,所有的艺术家都会被绘制到画布上。大多数艺术家都被绑在一个坐标轴上,这样的艺术家不能被多个轴共享,也不能从一个轴移动到另一个轴,要查看全部属性可点击https://gitee.com/hyisoe/typroa-picgo/raw/master/20210305145149.png

legend
官方示例:User guide: https://matplotlib.org/3.1.1/tutorials/intermediate/legend_guide.html
参数设置:API:https://matplotlib.org/3.1.1/api/legend_api.html?highlight=legend
legend 是图示的说明,主要的作用就是解释一下我们坐标轴里面的图形的含义(比如说针对x, y 对应的函数表达式,或者是曲线的意义(函数表达式)),legend 在英语里面的含义就是。
loc : str 或一对浮点数,默认值:rcParams[“legend.loc”] = ‘best’(‘best’ 为轴,‘右上角’ 为数字)
传说的位置。
字符串 ‘upper center’, ‘lower center’, ‘center left’, ‘center right’ 将图例放置在轴/图形相应边缘的中心。
字符串“center”将图例放置在轴/图形的中心。
字符串“best”将图例放置在迄今为止定义的九个位置中的位置,与其他绘制的艺术家的重叠最小。对于具有大量数据的绘图,此选项可能会很慢;您的绘图速度可能会因提供特定位置而受益。
位置也可以是一个 2 元组,给出轴坐标中图例左下角的坐标(在这种情况下 bbox_to_anchor 将被忽略)。
为了向后兼容,‘center right’(但没有其他位置)也可以拼写为 ‘right’,并且每个“字符串”位置也可以作为数值给出,例如loc = 0 等价于loc=“best"
| Location String | Location Code |
|---|---|
| ‘best’ | 0 |
| ‘upper right’ | 1 |
| ‘upper left’ | 2 |
| ‘lower left’ | 3 |
| ‘lower right’ | 4 |
| ‘right’ | 5 |
| ‘center left’ | 6 |
| ‘center right’ | 7 |
| ‘lower center’ | 8 |
| ‘upper center’ | 9 |
| ‘center’ | 10 |
legend 位置设置
可以在plt.legend 里面使用 loc 这个参数来设置我们的摆放的位置。例如 loc=“upper right”, 就放置在我们的边界盒子(bounding box)(注释:就是坐标轴的边界)里面的右上方 ,默认的设置就是坐标轴边界的设置 (0,0)(1,1)注解边界的默认设置就是(x0,y0,width,height)=(0,0,1,1).为了把这个legend 放置在我们的坐标轴边界的外部,我们,我们需要借助一个特殊的元祖(x0,y0),比如说放置在坐标轴边界的右下部。最常用的方法就是下面这个
plt.legend(loc=(1.04,1)),
这里的loc指的是我们的legend的左下角的那个顶点的坐标。这个是比较简单直接的方式。
此外,我们有一些通用的方法来手动的设置我们的legend box 放置的地方,那就是使用我们的bbox_to_anchor这个参数,在这里我们可以只提供bbox 的一个参数来作为限制就是提供 (x0,y0),它所处的方向就有loc 这个参数来提供
plt.legend(bbox_to_anchor=(1.04,1), loc="upper left")
那么就是横坐标是1,纵坐标是0,但是要多出来一点那我们就设置为1.04,0 , 这个loc决定的是放置在我们legend的这个边框的那个部位。loc = "lower left"就是知识我们这个anchor的放置的位置,就是在我们legend(注解)边框的着陆点。
例如:
l1 = plt.legend(bbox_to_anchor=(1.04,1), borderaxespad=0)
l2 = plt.legend(bbox_to_anchor=(1.04,0), loc="lower left", borderaxespad=0)
l3 = plt.legend(bbox_to_anchor=(1.04,0.5), loc="center left", borderaxespad=0)
l4 = plt.legend(bbox_to_anchor=(0,1.02,1,0.2), loc="lower left",
                mode="expand", borderaxespad=0, ncol=3)
l5 = plt.legend(bbox_to_anchor=(1,0), loc="lower right",
                bbox_transform=fig.transFigure, ncol=3)
l6 = plt.legend(bbox_to_anchor=(0.4,0.8), loc="upper right")

删除重复的图例 legend
 	from collections import OrderedDict
    import matplotlib.pyplot as plt
    #----------删除多余重复图例 方法2----------------------#
    handles, labels = plt.gca().get_legend_handles_labels()
    by_label = OrderedDict(zip(labels, handles))  #需要导入Collections模块
	plt.legend(by_label.values(), by_label.keys())
- plt的legend函数可接收两个参数,一个是handles列表,一个是label列表。
- 引入有序字典OrderedDict的目的就是去除冗余的图例,因为字典的键值不能重复(即重复的只保留一个)。
- 第一行的意思应该是迭代地将当前plt中存的所有handles和labels返回到handles变量和labels变量中,你之前所在画布上画的每一步应该都会存在plt中
- 上述代码的作用是:仅保留plt中存在的所有非同名的图例名称,不出现重复图例名称
maplotlib常用的的刻度定位器locator总结
1.刻度定位器与格式(Tick Locator)
Tick locating 与 Tick formatting 可参考官方文档:http://matplotlib.org/api/ticker_api.html
2.获取坐标轴刻度对象
- Matplotlib 中的 ticker 模块用于支持坐标轴刻度的修改,调用下列命令可以初步查看主副坐标轴刻度的数值定位方式(locator)与具体格式(formatter)等。
- 详细命令参考:http://matplotlib.org/api/axis_api.html
ax.xaxis.get_major_ticks()
ax.xaxis.get_minor_ticks()
ax.xaxis.get_major_locator()
ax.xaxis.get_minor_locator()
ax.xaxis.get_major_formatter()
ax.xaxis.get_minor_formatter()
123456
3.设置主副刻度对象属性
- (1)设置主副刻度格式
import numpy as np
import matplotlib.pyplot as plt
from matplotlib.ticker import MultipleLocator, FormatStrFormatter

t = np.arange(0.0, 100.0, 1)
s = np.sin(0.1*np.pi*t)*np.exp(-t*0.01)
ax = plt.subplot(111) #注意:一般都在ax中设置,不再plot中设置
plt.plot(t,s,'--r*')

#修改主刻度
xmajorLocator = MultipleLocator(20) #将x主刻度标签设置为20的倍数
xmajorFormatter = FormatStrFormatter('%5.1f') #设置x轴标签文本的格式
ymajorLocator = MultipleLocator(0.5) #将y轴主刻度标签设置为0.5的倍数
ymajorFormatter = FormatStrFormatter('%1.1f') #设置y轴标签文本的格式
#设置主刻度标签的位置,标签文本的格式
ax.xaxis.set_major_locator(xmajorLocator)
ax.xaxis.set_major_formatter(xmajorFormatter)
ax.yaxis.set_major_locator(ymajorLocator)
ax.yaxis.set_major_formatter(ymajorFormatter)

#修改次刻度
xminorLocator = MultipleLocator(5) #将x轴次刻度标签设置为5的倍数
yminorLocator = MultipleLocator(0.1) #将此y轴次刻度标签设置为0.1的倍数
#设置次刻度标签的位置,没有标签文本格式
ax.xaxis.set_minor_locator(xminorLocator)
ax.yaxis.set_minor_locator(yminorLocator)

#打开网格
ax.xaxis.grid(True, which='major') #x坐标轴的网格使用主刻度
ax.yaxis.grid(True, which='minor') #y坐标轴的网格使用次刻度
- (2)删除坐标轴的刻度显示
ax.yaxis.set_major_locator(plt.NullLocator())
ax.xaxis.set_major_formatter(plt.NullFormatter())
4、图像的标签相关设置——tick_param
ax.tick_params(axis=‘x’, tickdir=‘in’, labelrotation=20)参数详解
可以写成plt.tick_params(axis=‘both’, **kwargs), 也可以通过ax = plt.gca() ,写成ax.tick_params(axis=‘both’, **kwargs)
matplotlib.pyplot.tick_params参数:
- axis : 可选{‘x’, ‘y’, ‘both’} ,选择对哪个轴操作,默认是’both’
- reset : bool,如果为True,则在处理其他参数之前将所有参数设置为默认值。 它的默认值为False。
- which : 可选{‘major’, ‘minor’, ‘both’} 选择对主or副坐标轴进行操作
- direction/tickdir : 可选{‘in’, ‘out’, ‘inout’}刻度线的方向
- size/length : float, 刻度线的长度
- width : float, 刻度线的宽度
- color : 刻度线的颜色,我一般用16进制字符串表示,eg:’#EE6363’
- pad : float, 刻度线与刻度值之间的距离
- labelsize : float/str, 刻度值字体大小
- labelcolor : 刻度值颜色
- colors : 同时设置刻度线和刻度值的颜色
- zorder : float ,Tick and label zorder.
- bottom, top, left, right : bool, 分别表示上下左右四边,是否显示刻度线,True为显示
- labelbottom, labeltop, labelleft, labelright :bool, 分别表示上下左右四边,是否显示刻度值,True为显示
- labelrotation : 刻度值逆时针旋转给定的度数,如20
- gridOn: bool ,是否添加网格线; grid_alpha:float网格线透明度 ; grid_color: 网格线颜色; grid_linewidth:float网格线宽度; grid_linestyle: 网格线型
- tick1On, tick2On : bool分别表表示是否显示axis轴的(左/下、右/上)or(主、副)刻度线
- label1On,label2On : bool分别表表示是否显示axis轴的(左/下、右/上)or(主、副)刻度值
5、隐藏ticks 的label
import matplotlib.pylab as plt

fig, ax = plt.subplots()
plt.plot([1,2,3],[4,5,6])

ax.tick_params(labelbottom=True)

plt.show()#True 和 Fasle 对比


官网示例:matplotlib.axes.Axes.tick_params — Matplotlib 3.4.3 documentation
共享坐标轴也可以使得子图的标签不显示
axes 之间位置调整-如何防止x,y_label不显示、重叠
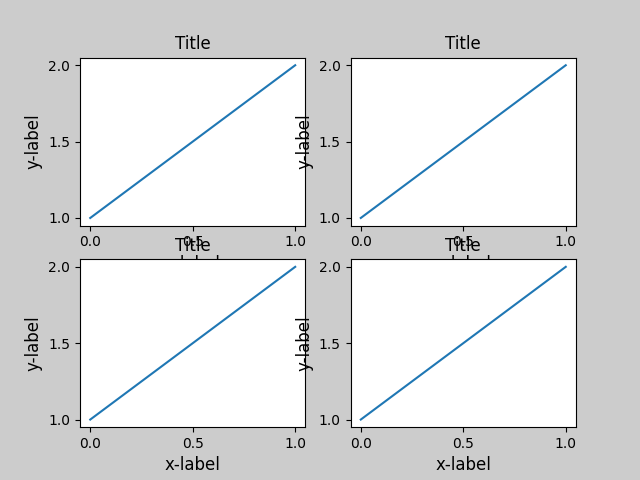
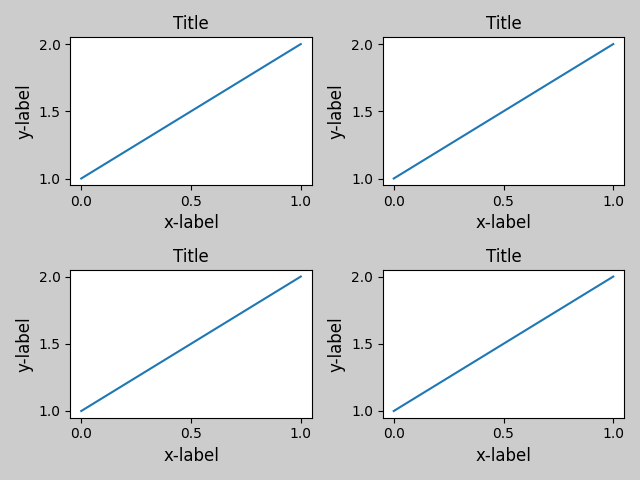
自动调整 tight_layout()
How to use tight-layout to fit plots within your figure cleanly.
tight_layout automatically adjusts subplot params so that the subplot(s) fits in to the figure area. This is an experimental feature and may not work for some cases. It only checks the extents of ticklabels, axis labels, and titles.
fig, ((ax1, ax2), (ax3, ax4)) = plt.subplots(nrows=2, ncols=2)
example_plot(ax1)
example_plot(ax2)
example_plot(ax3)
example_plot(ax4)
plt.tight_layout()
#使用前后对比


更多示例请点击:Tight Layout guide — Matplotlib 3.4.3 documentation
手动调整边距和子图的间距-subplots_adjust
说明、参数: Adjusting the spacing of margins and subplots调整边距和子图的间距
subplots_adjust(self, left=None, bottom=None, right=None, top=None,
                    wspace=None, hspace=None)

Tune the subplot layout.调整子图布局。
The parameter meanings (and suggested defaults) are:参数含义(和建议的默认值)是:

left  = 0.125  # the left side of the subplots of the figure图片中子图的左侧

right = 0.9    # the right side of the subplots of the figure图片中子图的右侧

bottom = 0.1   # the bottom of the subplots of the figure图片中子图的底部

top = 0.9      # the top of the subplots of the figure图片中子图的顶部

wspace = 0.2   # the amount of width reserved for space between subplots,

               # expressed as a fraction of the average axis width

#为子图之间的空间保留的宽度,平均轴宽的一部分

hspace = 0.2   # the amount of height reserved for space between subplots,

               # expressed as a fraction of the average axis height

#为子图之间的空间保留的高度,平均轴高度的一部分

加了这个语句,子图会稍变小,因为空间也占用坐标轴的一部分

fig.subplots_adjust(wspace=0.5,hspace=0.5)
官网说明与示例:matplotlib.pyplot.subplots_adjust — Matplotlib 3.4.3 documentation
字体和绘图样式设置recPram
,pylot使用rc配置文件来自定义图形的各种默认属性,称之为rc配置或rc参数。通过rc参数可以修改默认的属性,包括窗体大小、每英寸的点数、线条宽度、颜色、样式、坐标轴、坐标和网络属性、文本、字体等。详情可看自定义matplotlib样式recParam和style绘图风格_hyisoe的博客-CSDN博客
import matplotlib.pylab as pylab
import re
from adjustText import adjust_text

plt.style.use(['science', 'high-vis',"grid", 'no-latex'])
# plt.rcParams['font.family'] = 'Arial'  # 设置字体样式
# plt.rcParams['font.weight'] = 'bold'

myparams = {
   'axes.labelsize': '15',
   'axes.labelweight': 'bold',
    "ticklabel.fontsize":"10",
   'xtick.labelsize': '15',
   'ytick.labelsize': '15',
   'lines.linewidth': 1.5,
   'legend.fontsize': "15",
   'font.size': '15',
#    'legend.fontsize':"18",
   'font.family': 'Times New Roman',#设置字体
  "font.weight":"bold",
#    'figure.figsize': '16, 9'  #图片尺寸
}

pylab.rcParams.update(myparams)  #更新自己的设置
详细的参数:Customizing Matplotlib with style sheets and rcParams — Matplotlib 3.4.3 documentation
如何解解决绘制的文本重叠问题?
? 无论是title 还是其它文本,在python中我们都可以通过这个库函数去自动调整文本对象的位置,而不需要手动去调节,详细操作参考:adjustText解决matplotlib plt.text()文字重叠问题
多子图任意绘制
plt.subplots(), plt.add_subplot(),plt.GridSpec`:具体可参考:plt画网格图_Matplotlib 多子图绘制,
plt作图时出现横坐标或者纵坐标乱序的解决方法
出现上述情况的话如下所示:

可以看到Y轴坐标已经乱掉了。出现这种情况的主要原因在于:Y轴的值不是int或float这种数据,而是 string这种类型,导致转换成数据的时候出错。
严重的时候,如果数据比较大的时候,会出现以下的情况:
所以出现这种情况的时候,需要检查一下送入plt.plot等函数的x,y是否都是数据类型的list
如何让matplotlib绘图超出轴范围?
要使标记显示在轴之外,可以关闭剪裁。这可以使用plot命令clip_on=False中的关键字参数来完成。注:保存为svg 格式可能无法生效
例如:
import matplotlib.pyplot as plt
plt.plot(range(5), range(5), 'ro', markersize=20, clip_on=False, zorder=100)
plt.show()
参考线,水平axhline()、垂直axvline() 选取范围,x范围axvspan()、y范围axhspan()
plt.axhline(y=2.5,c='red',ls='--',lw=3)
plt.axvline(x=2,c='green',ls='--',lw=3)

plt.axvspan(xmin=4,xmax=6,facecolor='b',alpha=0.3)# facecolor 背景色 alpha :透明度
#选取y范围
plt.axhspan(ymin=4,ymax=8,facecolor='r',alpha=0.3)

