第一个python程序
一、 环境配置
1.1 anconda安装
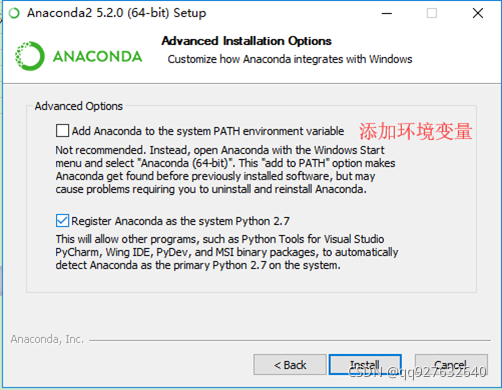
Anaconda是一个开源Python发行版本,其中包括Python发现版本,以及依赖模块。下载地址:https://www.anaconda.com/download/ 选择Python3版本。使用默认安装选项即可。特别提示:
anconda安装成功后,在开始菜单中有anconda程序包。
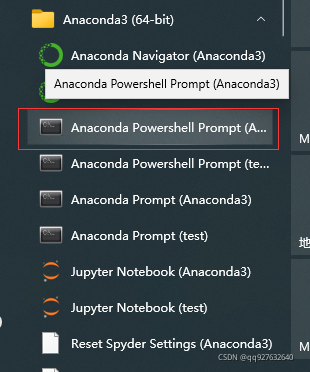
打开上图中红框中的命令窗口,输入conda –version 查看annconda版本。

点击“Anaconda Navigator(Anaconda3) ”,打开Anaconda窗口,创建python虚拟环境。
1.2 虚拟环境管理
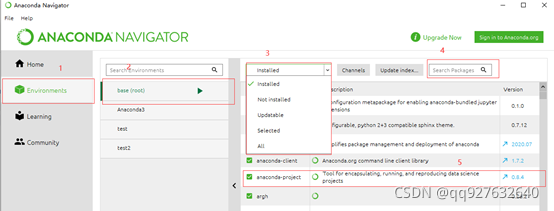
点击上图红框1,右端显示windows中已经设置的conda环境,点击红框2,其右端显示该环境中的安装包信息。点击红框3中的下拉列表框,选择“installed”,下方列表框中显示已经安装的工具包。在红框4中可以检索需要的工具包。红框5是工具版本信息。
下面介绍虚拟管理的部分conda命令。
1.2.1 创建conda虚拟环境
conda create –name test3
1.2.2 查看已经创建的conda虚拟环境
conda env list
1.2.3 删除conda虚拟环境
conda remove –name test3
1.2.4 切换conda环境
conda activate test3
1.2.5 conda环境管理命令说明
#创建一个名为test3的环境,指定Python版本是(conda默认最新版本)

conda create --name test3 python=3.8

#安装好后,使用activate激活某个环境

activate test3 # for Windows

source activate test3 # for Linux & Mac

#激活后,会发现terminal输入的地方多了test3的字样,

#此时,再次输入

python --version

#可以得到`Python 3.8.3,即系统已经切换到了3.8的环境

#如果想返回默认环境,运行

deactivate test3 # for Windows
source deactivate test3 # for Linux & Mac

#删除一个已有的环境

conda remove --name test3 --all
1.2.6 安装第三方模块
conda install requests
1.2.7 卸载第三方模块
conda remove requests
1.2.8 查看环境中已经安装的模块
conda list
1.2.9 导入导出环境
导出环境
conda env export > test3.yaml
使用已经保存的环境信息,创建环境
conda env create –f test3.yaml
1.3 pythcarm安装
PyCharm官网:https://www.jetbrains.com下载Community版本,下载后双击安装,使用默认选项安装,安装成功后,界面下。

选择皮肤配置后,剩余选项可以使用默认值。
1.4 git安装
到git官网https://git-scm.com/downloads,下载git安装包,使用默认选项安装,安装后,在pycharm设置中添加git安装路径。
在pycharm中点击File->setting,打开设置窗口,
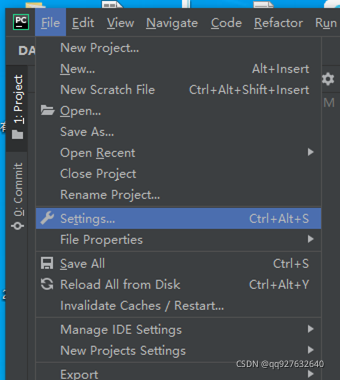

在Version Control->Git->Path to Git executable中设置git路径。
二、 hello word
2.1 创建项目
在pycham中点击File->project,打开创建项目窗口

设置项目保持目录,选择已经设置好的conda虚拟环境。
2.2 创建文件
在pycham中点击File->new,打开新建窗口
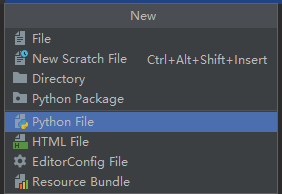
点击“Python FilePython”文件。输入文件名,保存。
文件中以“#”开头的行是注释行,在两个“”“””间的行是注释块。
2.2打印hello word
在文件中输入print(‘Hello word!’)。点击Run->run
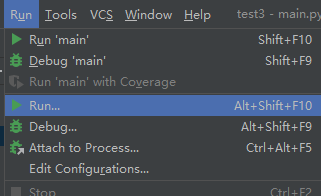
选择刚建立的文件”main.py”,则在main窗口中打印‘Hello word!’。

2.3 函数定义
python函数是以def关键词开头,函数名,括号,最后是冒号结尾。其括号内是参数。函数体比def关键字缩减4个空格。下面是封装打印”Hello word!”函数定义。
2.4 模块导入
使用import 模块名,导入模块。下面以导入numpy模块为例。
import numpy as np
arrary = np.array([0, 1 , 2])
print(‘array:’, arrary)
其中as将numpy重命名为np。

三、 数据结构
本部分介绍python的4个数据结构,以及普通数组的构建。
3.1 列表
列是的关键字是list,有多种方法。
list.append(x),向列表末尾添加元素。
list.extend(x),将列表中的元素全部添加到列表尾部。
list.insert(i,x),在指定位置插入元素。
list.remove(x),删除列表中值等于x的元素。
list.pop([i]),删除指定元素,并且返回该元素的值,如果没有指定位置,默认操作最后一个元素。
list.clear(),清除列表,相当于del a[:]。
list.index(x), 返回x在列表中的位置。
list.count(x), 返回x在列表中出现的次数。
list.sort (*, key=None, reverse=False), 对列表进行排序。
list.reverse(),列表倒序。
list.copy(),复制列表。
代码举例。
>>> fruits = ['orange', 'apple', 'pear', 'banana', 'kiwi', 'apple', 'banana']
>>> fruits.count('apple')
2
>>> fruits.count('tangerine')
0
>>> fruits.index('banana')
3
>>> fruits.index('banana', 4)  # Find next banana starting a position 4
6
>>> fruits.reverse()
>>> fruits
['banana', 'apple', 'kiwi', 'banana', 'pear', 'apple', 'orange']
>>> fruits.append('grape')
>>> fruits
['banana', 'apple', 'kiwi', 'banana', 'pear', 'apple', 'orange', 'grape']
>>> fruits.sort()
>>> fruits
['apple', 'apple', 'banana', 'banana', 'grape', 'kiwi', 'orange', 'pear']
>>> fruits.pop()
'pear'
3.2 字典
关键词是dict()。字典元素格式是key:value,并且使用大括号括起来。
>>>tel = {'jack': 4098, 'sape': 4139}
>>> tel['guido'] = 4127
>>> tel
{'jack': 4098, 'sape': 4139, 'guido': 4127}
3.3 元组
元组由多个以逗号分隔的值组成。
>>> t = 12345, 54321, 'hello!'
>>> t[0]
12345
>>> t
(12345, 54321, 'hello!')
3.4 数据集
关键词是set()。集合是没有重复元素的无序集合。基本的用途包括成员测试和消除重复条目。集合对象还支持数学运算,如并、交、差和对称差。
>>> basket = {'apple', 'orange', 'apple', 'pear', 'orange', 'banana'}
>>> print(basket)                      # show that duplicates have been removed
{'orange', 'banana', 'pear', 'apple'}
>>> 'orange' in basket                 # fast membership testing
True

>>> a = set('abracadabra')
>>> b = set('alacazam')
>>> a                                  # unique letters in a
{'a', 'r', 'b', 'c', 'd'}
>>> a - b                              # letters in a but not in b
{'r', 'd', 'b'}
>>> a | b                              # letters in a or b or both
{'a', 'c', 'r', 'd', 'b', 'm', 'z', 'l'}
>>> a & b                              # letters in both a and b
{'a', 'c'}
>>> a ^ b                              # letters in a or b but not both
{'r', 'd', 'b', 'm', 'z', 'l'}
3.5 数组
python数据需要借助numpy来生成。命令语句如下。
numpy.array([0,1])。
#生成10*10的0矩阵,
numpy.zeros((2,2))

四、 使用控制语句
python代码中的控制语句以冒号结尾,控制语句内的代码比控制语句行缩进。建议缩进4个空格。
4.1 使用if语句举例
if __name__ == '__main__':
print('Hello word!')
如果名称等于'__main__',则打印“Hello word!”。
4.2 使用for语句举例
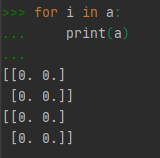
4.3 使用while语句举例
i=0
while i<2:
...     i = i+1
...     print(i)
...
1
2
五、 画图
python使用matplotlib画图,因此在画图前需要导入matplotlib模块。
import matplotlib.pyplot as plt
def fun(t):
    return np.exp(-t) * np.cos(2*np.pi*t)
arrary = np.array([0, 1 , 2])
print('array:', arrary)

t1 = np.arange(0.0, 5.0, 0.1)
t2 = np.arange(0.0, 5.0, 0.02)

plt.rcParams['font.sans-serif'] = ['SimHei']
plt.rcParams['axes.unicode_minus'] = False

plt.figure("2subplot")
plt.subplot(211)
plt.plot(t1, fun(t1), 'bo', t2, fun(t2), 'k')
plt.title('子图1')
plt.xlabel('时间/s')
plt.ylabel('幅度值')
plt.tight_layout(pad=1.5, h_pad=None, w_pad=None, rect=None)
plt.subplot(212)
plt.plot(t2, np.cos(2 * np.pi * t2), 'r--')
plt.title('子图2')
plt.xlabel('时间/s')
plt.ylabel('幅度值')
plt.tight_layout(pad=1.5, h_pad=None, w_pad=None, rect=None)
plt.show()

六、 创建个人模块
在项目目录下建立模块目录,如plot_data目录,目录下一定要建立__init__.py文件,文件内容可以是空,但是一定要存在。另外创建功能文件,可以是单独的函数,或是类。下面以创建类为例,进行说明。首先创建文件夹与文件。

本例中__init__.py是空文件。plot_data.py是类文件,功能是用于画图,下面是plot_data.py文件中部分代码。
import matplotlib.pyplot as plt
import numpy as np

class plot_classify:
    """
    show data
    """
    def __init__(self, name):
        self.name = name

def plot_classify_subplt_win_width(self, result_flag_statistics, result_flag_buf, data_flag, event_level, figsize=(9, 11)):
    plt.rcParams['font.sans-serif'] = ['SimHei']
    plt.rcParams['axes.unicode_minus'] = False
    ind = np.arange(5)

    win_key = list(result_flag_statistics.keys())
    win_num = win_key.index(win_key[-1]) + 1
    data_key = result_flag_statistics[win_key[0]].keys()
    for data_key in data_key:
        fig, axs = plt.subplots(win_num, 1, figsize=figsize)

        for n in np.arange(win_num):
            axs[n].plot(result_flag_buf[win_key[n]][data_key])
            if n < win_num - 2:
                plt.tight_layout(pad=0.20, h_pad=None, w_pad=None, rect=None)
            else:
                plt.tight_layout(pad=1.8, h_pad=None, w_pad=None, rect=None)
            event_key = list(event_level.keys())
            event_key.remove(data_flag[data_key])
            title_en = str(' ')
            for event_key in event_key:
                title_en = title_en + ',' + format(event_level[event_key]) + ":[" + \
                           format(int(result_flag_statistics[win_key[n]][data_key][0][event_key][0])) + ' ' + \
                           result_flag_statistics[win_key[n]][data_key][0][event_key][1].__format__('.4f') + ']'

            title = 'win:' + format(win_key[n]) + 's[' + format(
                result_flag_statistics[win_key[n]][data_key][1]) + ']' + data_flag[data_key] + \
                    '[' + format(int(result_flag_statistics[win_key[n]][data_key][0][data_flag[data_key]][0])) + ' ' + \
                    result_flag_statistics[win_key[n]][data_key][0][data_flag[data_key]][1].__format__('.4f') + ']' + ':' \
                    + format(event_level[data_flag[data_key]]) + title_en
            axs[n].set_title(title)
            axs[n].set_ylim(-0.1, 4.1)
            axs[n].set_yticks(ind)
            #axs[n].set_yticklabels(('0', '1', '2', '3', '4'))
            axs[n].set_yticklabels(ind.tolist())
            # axs[0].set_xlim(0, 2)
            # axs[n].set_xlabel(xlabel)
            axs[n].set_ylabel('事件编号')
        axs[win_num - 1].set_xlabel(data_flag[data_key] + "信号,横坐标是窗口分段索引号。title格式:事件【信号个数, 占比】")
        plt.show()
在使用模块时,需要导入,定义好类后,即可使用。代码实例如下。
from plot_data.plot_data import plot_classify
plot_classify = plot_classify('dat plot')
plot_classify.plot_classify_subplt_win_width(result_flag_statistics, result_flag_buf, data_flag, event_level,
                                             figsize=(9, 9))
七、 读取二进制文件
读取二进制文件使用到文件读取模块,struct模块与os模块,其中struct模块与os模块需要单独导入,导入命令。
import os,即可导入os模块。
import struct,即可导入struct模块。
由于将二进制文件内容读取到数组后,数据是以字节为单位存储的,需要使用struct模块中unpack进行抽取成对用类型数据。同时需要主要大小端的问题。
if os.path.isfile(file_path):
    f = open(file_path, "rb")

    Data_byte = f.read()

    head = np.zeros(head_num, dtype='int')
    j = 0
    for d_i in range(head_num):
        head[d_i] = struct.unpack("i", Data_byte[j:j + 4])[0]
        j = j + 4
    f.close()
上面代码是从二进制文件中抽取head_num个整形。
八、 mat文件读取与保存
mat文件是matlab数据文件,需要使用scipy模块进行读写,因此需要导入scipy模块。
import scipy.io as scio
dataNew = 'E://dataNew.mat'
scio.savemat(file_name, {mat_name: data_ff[:, sec_i:sec_i+sec_num]})
data[file] = scio.loadmat(filepath)
其中scio.loadmat(filepath)是读取mat文件,filepath存放的完整文件路径,如’E://dataNew.mat’。
scio.savemat(file_name, {mat_name: data_ff[:, sec_i:sec_i+sec_num]}其中file_name里存放的是完整路径的文件名。mat_name是mat内数据变量名的文件名。data_ff是需要保存的数据。
九、 保存excel文件
在实际使用中需要将数据分析结果以表格的形式保存到excel表格,python使用openpyxl模块,将数据保存到excel模块中。如果要突出部分表格可以将表格背景设置不同颜色,当表格内字符超过表格默认宽度后,可以设置表列宽。代码实例如下。
import openpyxl
from openpyxl.styles import PatternFill
from openpyxl.utils import get_column_letter

class save_data_2xlsx:
    def __init__(self, name):
        self.name = name
        self.wb = openpyxl.Workbook()
        n2 = str(self.wb.sheetnames[0])
        del self.wb[n2]

    def auto_set_column_width(self, sheet_name="sheet1"):
        ws=self.wb[sheet_name]

        i = 0
        col_width = []
        for col in ws.columns:
            for j in range(len(col)):
                if 0 == j:
                    col_width.append(len(str(col[j].value)))
                else:
                    if col_width[i] < len(str(col[j].value)):
                        col_width[i] = len(str(col[j].value))
            i = i + 1

        for i in range(len(col_width)):
            col_letter = get_column_letter(i+1)
            if col_width[i] > 100:
                ws.column_dimensions[col_letter].width = 100
            elif ws.column_dimensions[col_letter].width < col_width[i]:
                ws.column_dimensions[col_letter].width = col_width[i] + 2

    def creat_sheet_hmm_result_stats_2xlsx(self, tow_layer_dict, sheet_name="sheet1"):
        ws = self.wb.create_sheet(sheet_name)
        firest_green_fill = PatternFill(fill_type='solid', fgColor="0099CC00")
        second_orange_fill = PatternFill(fill_type='solid', fgColor="FFC125")

        row_keys = list(tow_layer_dict.keys())
        col_keys = list(tow_layer_dict[row_keys[0]][0])
        col_idx = 2
        for col_key in col_keys:
            ws.cell(row=1, column=col_idx).value = col_key
            col_idx = col_idx + 1
        ws.cell(row=1, column=col_idx).value = "总数"

        row_idx = 2
        for row_key in row_keys:
            ws.cell(row=row_idx, column=1).value = row_key
            row_idx = row_idx + 1

        row_idx = 2
        for row_key in row_keys:
            col_key = list(tow_layer_dict[row_key][0])
            col_idx = 2

            sd = sorted(tow_layer_dict[row_key][0].items(), key=lambda x: x[1][1], reverse=True)

            for col_key in col_key:
                ws.cell(row=row_idx, column=col_idx).value = format(int(tow_layer_dict[row_key][0][col_key][0])) + ' ('\
                        + tow_layer_dict[row_key][0][col_key][1].__format__('.4f') + ')'
                if col_key == sd[0][0]:
                    ws.cell(row=row_idx, column=col_idx).fill = firest_green_fill
                elif col_key == sd[1][0]:
                    ws.cell(row=row_idx, column=col_idx).fill = second_orange_fill
                col_idx = col_idx + 1
            ws.cell(row=row_idx, column=col_idx).value = tow_layer_dict[row_key][1]
            row_idx = row_idx + 1
            self.auto_set_column_width(sheet_name)

    def save_workbook(self, xlsx_name):
        self.wb.save(xlsx_name)
代码交流
qq:927632640
wx:Ynkj20200926
