这篇文章教大家如何在Python中使用免费的数据接口获取我们想要的各基金历史净值数据,以便我们进行后续的基金量化分析。
一、接口地址与格式
这里使用的接口地址是https://api.doctorxiong.club/v1/fund/detail?code=xxx,其中xxx为基金对应代号。
这里我们随便选一个例子,比如“公募一哥”张坤的易方达蓝筹精选混合,代号005827,对应的接口地址就是https://api.doctorxiong.club/v1/fund/detail?code=005827
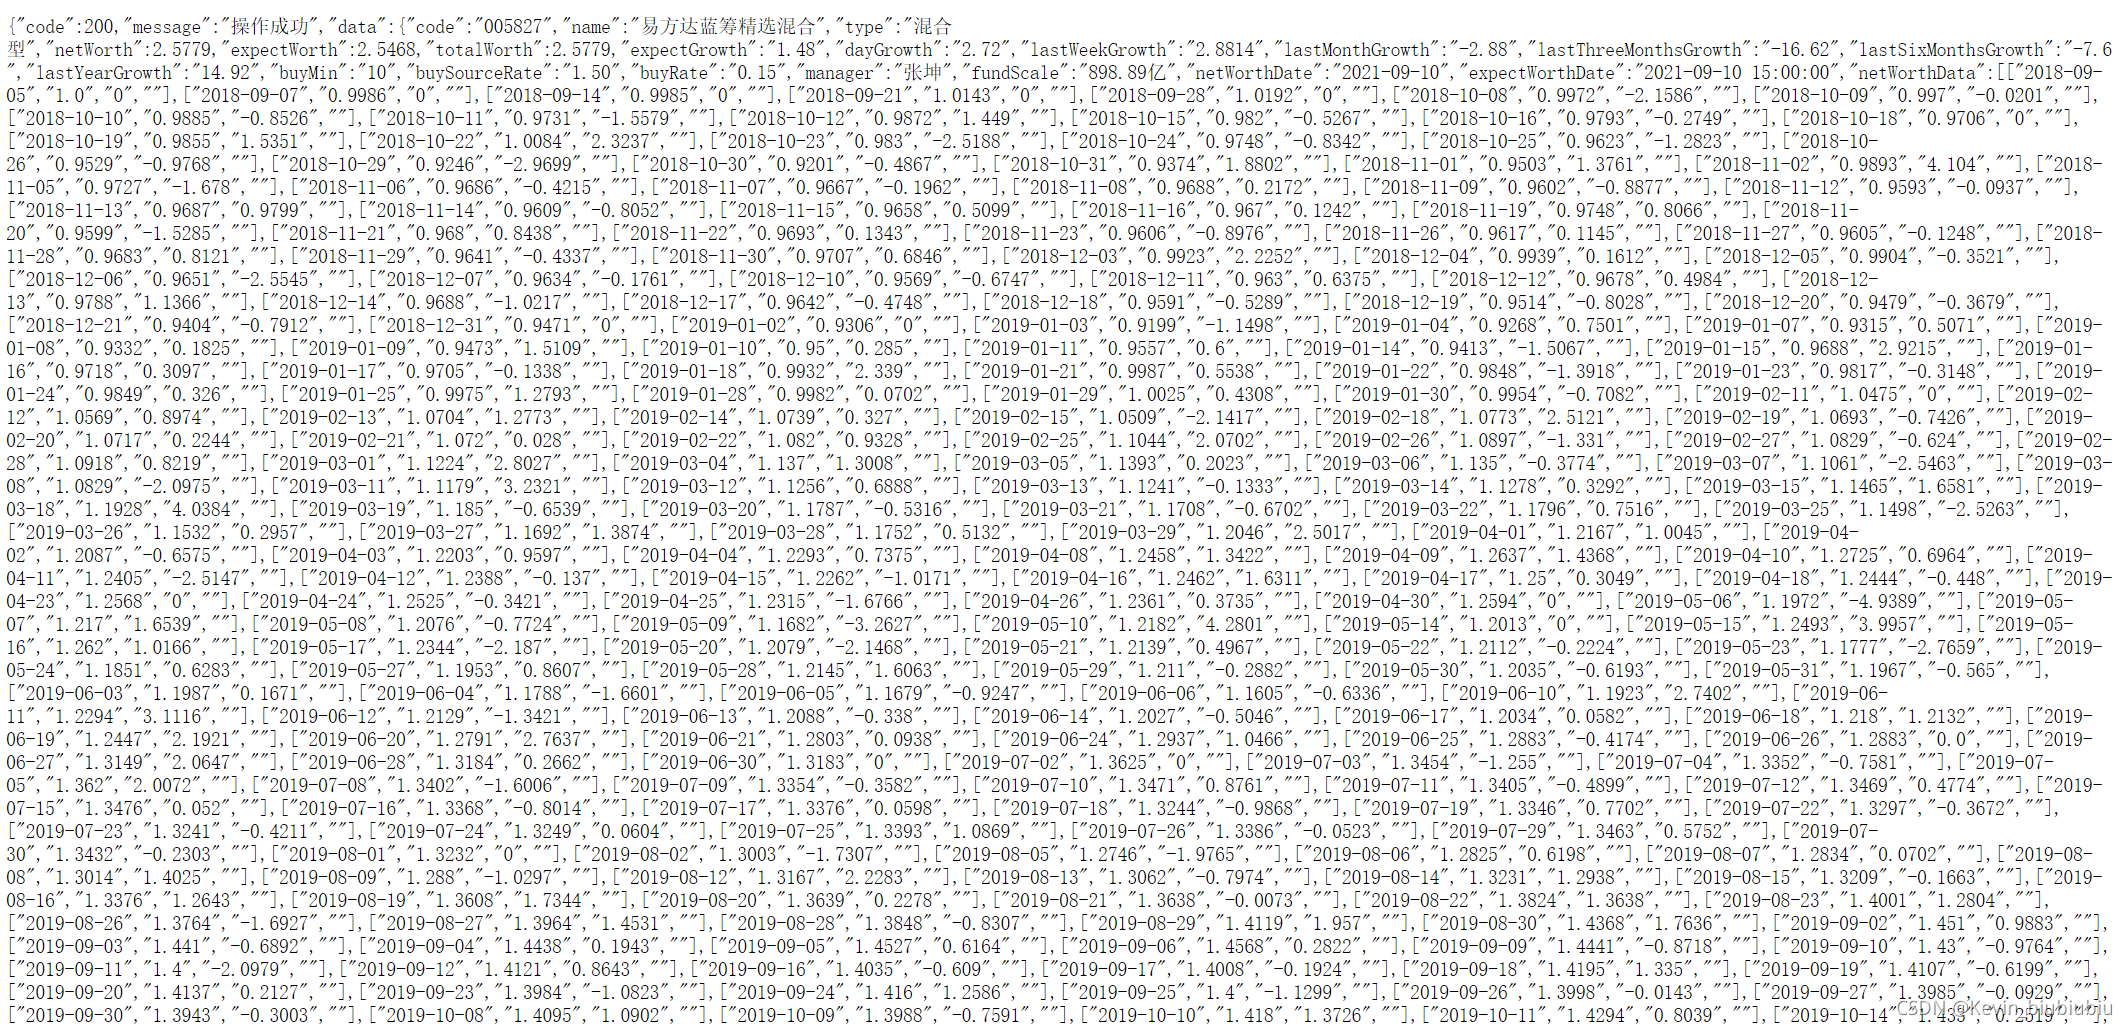
我们用浏览器打开看看,是下面这样的数据格式:

分析结果,该接口返回的是一个字典,里面的key有"code",“message”,“data”。
其中"data"又是一个字典,里面包括该基金的各种信息和数据的key,比如"code",“name”,"manager"等等;
该基金的历史单位净值和历史累计净值数据就对应于其中的"netWorthData"和"totalNetWorthData"的key里。(大家可以自行观察一下)
二、获取数据与整理
使用到的库:
import urllib
from bs4 import BeautifulSoup
import json
import pandas as pd
先对接口地址发起请求,并利用beautifulsoup解析标签的功能来获取上面所示的文本信息。
>>> html=urllib.urlopen("https://api.doctorxiong.club/v1/fund/detail?code=005827")
>>> bsobj=BeautifulSoup(html.read())
>>> p_text = bsobj.p.get_text()
此时得到的p_text是unicode类型的文本,我们需要利用json将它转换成字典的数据类型。
>>> text_dict = json.loads(p_text)
现在我们来看一下这个字典里是不是有我们刚刚提到的各种key:
>>> print text_dict['data']['code']
005827
>>> print text_dict['data']['name']
易方达蓝筹精选混合
>>> print text_dict['data']['manager']
张坤
然后取出历史单位净值和历史累计净值,每天的数据都是以列表的形式保存,最后一个对象对应着今天的净值情况,我们输出看一看。
>>> Wdata1 = text_dict['data']['netWorthData']
>>> Wdata2 = text_dict['data']['totalNetWorthData']
>>> print Wdata1[-1]
[u'2021-09-10', u'2.5779', u'2.72', u'']
>>> print Wdata2[-1]
[u'2021-09-10', u'2.5779']
因为这个基金没有过分红派息,所以单位净值和累计净值是一样的,都是2.5779。值得注意的是单位净值里还有日涨幅率的数据,也就是上面的2.72。
最后我们把累计净值数据转换成float类型,并整体保存成DataFrame的数据类型。
>>> for i in Wdata2:
    i[1] = float(i[1])
>>> Wdf = pd.DataFrame(Wdata2,columns=['Date','Worth'],dtype=float)
>>> print Wdf
           Date   Worth
0    2018-09-05  1.0000
1    2018-09-07  0.9986
2    2018-09-14  0.9985
3    2018-09-21  1.0143
4    2018-09-28  1.0192
5    2018-10-08  0.9972
6    2018-10-09  0.9970
7    2018-10-10  0.9885
8    2018-10-11  0.9731
9    2018-10-12  0.9872
10   2018-10-15  0.9820
11   2018-10-16  0.9793
12   2018-10-18  0.9706
13   2018-10-19  0.9855
14   2018-10-22  1.0084
15   2018-10-23  0.9830
16   2018-10-24  0.9748
17   2018-10-25  0.9623
18   2018-10-26  0.9529
19   2018-10-29  0.9246
20   2018-10-30  0.9201
21   2018-10-31  0.9374
22   2018-11-01  0.9503
23   2018-11-02  0.9893
24   2018-11-05  0.9727
25   2018-11-06  0.9686
26   2018-11-07  0.9667
27   2018-11-08  0.9688
28   2018-11-09  0.9602
29   2018-11-12  0.9593
..          ...     ...
680  2021-08-02  2.5664
681  2021-08-03  2.5785
682  2021-08-04  2.5596
683  2021-08-05  2.5337
684  2021-08-06  2.5355
685  2021-08-09  2.5653
686  2021-08-10  2.6544
687  2021-08-11  2.6350
688  2021-08-12  2.5897
689  2021-08-13  2.5887
690  2021-08-16  2.5718
691  2021-08-17  2.4887
692  2021-08-18  2.5224
693  2021-08-19  2.4838
694  2021-08-20  2.4039
695  2021-08-23  2.4548
696  2021-08-24  2.5038
697  2021-08-25  2.5281
698  2021-08-26  2.4635
699  2021-08-27  2.4561
700  2021-08-30  2.4472
701  2021-08-31  2.4386
702  2021-09-01  2.5119
703  2021-09-02  2.5006
704  2021-09-03  2.5057
705  2021-09-06  2.5506
706  2021-09-07  2.5704
707  2021-09-08  2.5484
708  2021-09-09  2.5097
709  2021-09-10  2.5779

[710 rows x 2 columns]
最后的最后,,建议把"Date"转换成datetime的类型,这样方便日后放入各种量化框架中进行测试。
>>> Wdf['Date'] = pd.to_datetime(Wdf['Date'],format='%Y-%m-%d')