1. 前言
分时图的绘制,先必须有个股的分时信息数据作为支撑,在我前面的博客中我已经介绍了分时信息的采集与处理并张贴了完整代码。基于分时信息中,当前的price(股价),volume(手),可以计算出成交额mount=price*volume,而我们在券商软件上看到黄色线,也就是均线。它的计算其实就是计算每时每刻的总成交额除以总成交量。将它生成一个均价列表,与价格列表相对应,再由matplotlib将其生成,就能生成图像。
2. 所需要的类库
import urllib
import re
import pandas as pd
import time
import matplotlib.pyplot as plt
3. get_tick_df函数,获取分时信息
def get_tick_df(code):
    url='''http://push2ex.eastmoney.com/getStockFenShi?pagesize=10000&ut=7eea3edcaed734bea9cbfc24409ed989&dpt=wzfscj&cb=jQuery112406693353483965965_1632540327931&pageindex=0&id='''+code+'''2&sort=1&ft=1&code='''+code+'''&market='''+str(get_market(code))+'''&_=1632540328041'''
    Max_Retry_Times = 3  # 最大允许重试次数
    while True:
        try:
            html = urllib.request.urlopen(url, timeout=5).read()
            print(code+'请求成功')
            break
        except:
            Max_Retry_Times = Max_Retry_Times - 1
            if Max_Retry_Times == 0:
                break
            print('超时重试')

    html = html.decode('utf-8')
    #这里是将获取到的数据进行字符串操作剥开层层外衣
    pre1_data = re.findall(r'[(](.*?)[)]', html)
    data_list = str(pre1_data).replace('[', 'q').replace(']', 'q').split('q')
    pre2_data = data_list[2]
    #留下来的是字典类型书写格式的字符串
    #然后转为字典,再转换为dataframe类型
    df = pd.DataFrame.from_dict(eval(pre2_data), orient='columns')
    # time:时间,92503对应09:25:03
    df=df.rename(columns={'t':'time','p':'price','v':'volume','bs':'bs'})
    price_list=[]
    time_format_list=[]
    for i in range(len(df)):
       price_list.append(round(df['price'][i]/1000,3))
       time_format_list.append(time_format(df['time'][i]))
    df['price']=price_list
    df['time']=time_format_list

    return df
def time_format(time):
    time=str(time)
    if len(time)==5:
        return '0'+time[:1]+':'+time[1:3]+':'+time[3:]
    else:
        return time[:2]+':'+time[2:4]+':'+time[4:]
以上代码中我将抓包获取到的信息经过整理(注:url中的ut参数是user_token的意思,如果这个token过期将请求不到数据,如果请求失败可在下方留言,我看到后会帮你解决。),变成比较方便的dataframe数据类型。
4. fs_draw函数,绘制分时图
def fs_draw(code):
    # 显示中文标签
    plt.rcParams['font.sans-serif'] = ['SimHei']
    plt.rcParams['axes.unicode_minus'] = False
    df=get_tick_df(code)
    #print(df)
    # 分析每只股票分时信息,找到黄线=总成交额/总成交量(均线生成)
    volume_all = 0.0
    mount_all = 0.0
    yellow_ele_list = []
    for i in range(len(df)):
        volume_all = volume_all + float(str(df['volume'][i])) * 100
        mount_all=mount_all+float(str(df['volume'][i])) * 100*float(str(df['price'][i]))
        yellow_ele = mount_all / volume_all
        yellow_ele = round(yellow_ele, 2)
        # 添加到黄线元素集合
        yellow_ele_list.append(yellow_ele)

    df['yellow_line'] = yellow_ele_list
    #5个正则来割分时图
    pattern1 = re.compile(r'09:30:\d{2}')
    pattern2 = re.compile(r'10:30:\d{2}')
    pattern3 = re.compile(r'11:30:\d{2}')
    pattern4 = re.compile(r'14:00:\d{2}')
    pattern5 = re.compile(r'15:00:\d{2}')
    #指针
    p1 = 0
    p2 = 0
    p3 = 0
    p4 = 0
    p5 = 0
    #单次标记
    ok1 = 0
    ok2 = 0
    ok3 = 0
    ok4 = 0
    ok5 = 0
    for i in range(len(df['time'])):
        if re.match(pattern1, str(df['time'][i]), flags=0)!=None and ok1==0:
            ok1=1
            p1=i
        if re.match(pattern2, str(df['time'][i]), flags=0)!=None and ok2==0:
            ok2=1
            p2=i
        if re.match(pattern3, str(df['time'][i]), flags=0)!=None and ok3==0:
            ok3=1
            p3=i
        if re.match(pattern4, str(df['time'][i]), flags=0)!=None and ok4==0:
            ok4=1
            p4=i
        if re.match(pattern5, str(df['time'][i]), flags=0)!=None and ok5==0:
            ok5=1
            p5=i
    x = range(len(df['time']))
    y1 = df['price']
    y2=df['yellow_line']
    plt.figure(figsize=[10, 4])
    plt.plot(x, y1,y2)
    #时间区间划定
    if ok1==1 and ok2==1 and ok3==1 and ok4==1 and ok5==1:
        plt.xticks([p1,p2,p3,p4,p5],[str(df['time'][p1]),str(df['time'][p2]),str(df['time'][p3]),str(df['time'][p4]),str(df['time'][p5])])
    elif ok1 == 1 and ok2 == 1 and ok3 == 1 and ok4 == 1:
        plt.xticks([p1, p2, p3, p4],
                   [str(df['time'][p1]), str(df['time'][p2]), str(df['time'][p3]), str(df['time'][p4])])
    elif ok1 == 1 and ok2 == 1 and ok3 == 1:
        plt.xticks([p1, p2, p3],
                   [str(df['time'][p1]), str(df['time'][p2]), str(df['time'][p3])])
    elif ok1 == 1 and ok2 == 1:
        plt.xticks([p1, p2],
                   [str(df['time'][p1]), str(df['time'][p2])])
    elif ok1 == 1:
        plt.xticks([p1],
                   [str(df['time'][p1])])
    else:
        return 0
    # 设置标题
    plt.title(str(code)+'分时图')
    # 设置 x 和 y 轴名称
    plt.xlabel('时间')
    plt.ylabel('价格')
    plt.show()
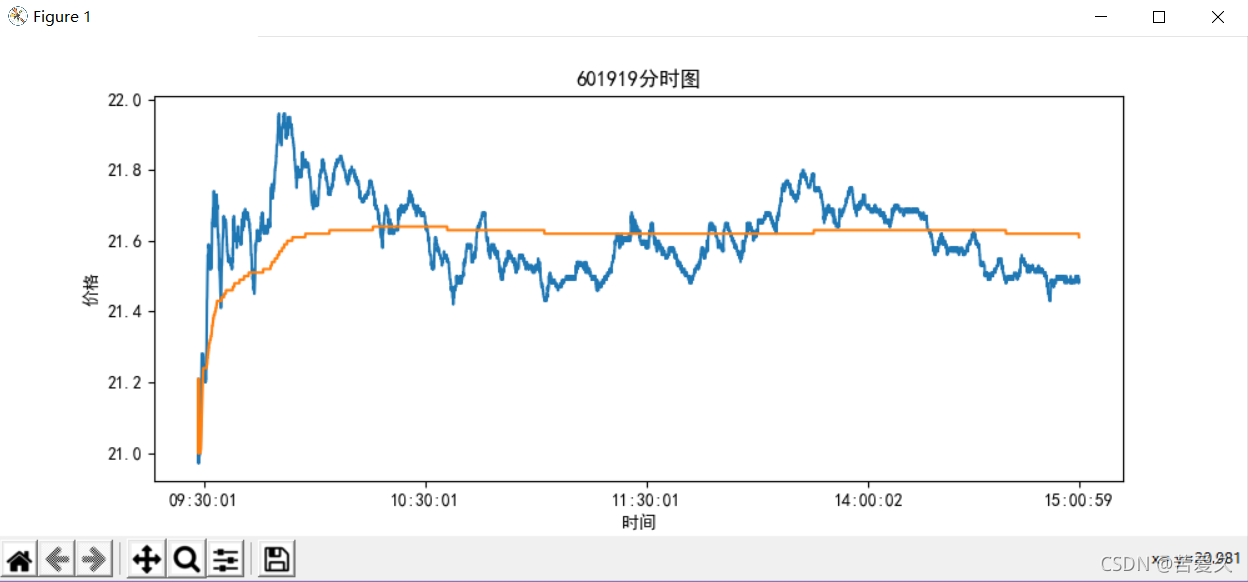
这里我调用了获取分时信息的函数后,按照我在前言中的计算公式,即可得到分时信息图。分时图信息是与券商实时同步的,不包含集合竞价。
5 .运行效果 (以601919为例)

与东方财富所显示的完全相同

如有疑问可在下方留言。