文章目录
#忽略一些版本不兼容等警告
import warnings
warnings.filterwarnings("ignore")
Matplotlib
plot
简单示例
import numpy as np
from matplotlib import pyplot as plt

x = np.arange(1,11)
y =  2  * x +  5
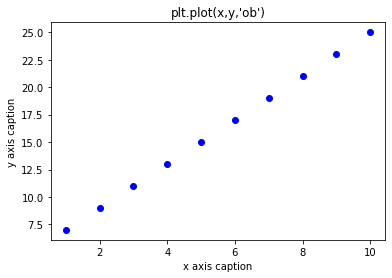
plt.title("plt.plot(x,y,'ob')")
plt.xlabel("x axis caption")
plt.ylabel("y axis caption")
plt.plot(x,y,"ob")
plt.show()

plt.title("plt.plot(x,y) ")
plt.xlabel("x axis caption")
plt.ylabel("y axis caption")
plt.plot(x,y)
plt.show()

plt.title("plt.plot(x,y,'--') ")
plt.xlabel("x axis caption")
plt.ylabel("y axis caption")
plt.plot(x,y,"--")
plt.show()

# 多条曲线一起画
plt.title("plt.plot(x,y,'ob',x,y,'red') ")
plt.xlabel("x axis caption")
plt.ylabel("y axis caption")
plt.plot(x,y,"ob",x,y,'red')
plt.show()


=============    ===============================
character        description
=============    ===============================
``'-'``          solid line style 实线
``'--'``         dashed line style 虚线
``'-.'``         dash-dot line style 点画线
``':'``          dotted line style 点线
=============    ===============================
线型、点型、线宽、颜色
import numpy as np
import matplotlib.pyplot as plt
import random

cnames1 = {
'blue':                 '#0000FF',
'blueviolet':           '#8A2BE2',
'brown':                '#A52A2A',
'burlywood':            '#DEB887',
'cadetblue':            '#5F9EA0',
'chartreuse':           '#7FFF00',
'chocolate':            '#D2691E',
'coral':                '#FF7F50',
'cornsilk':             '#FFF8DC',
'crimson':              '#DC143C',
'cyan':                 '#00FFFF',
'gold':                 '#FFD700',
'goldenrod':            '#DAA520',
'gray':                 '#808080',
'green':                '#008000',
'pink':                 '#FFC0CB',
'plum':                 '#DDA0DD',
'powderblue':           '#B0E0E6',
'purple':               '#800080',
'red':                  '#FF0000'}

clist1 = list(cnames1.values())
cnames2 = {}
for key,value in cnames1.items():
    cnames2[value] = key

Y = np.linspace(0,1,10)
X = np.ones(Y.size)
W = [0.25,0.50,0.75,1,2,3,4,5,6,7,8]
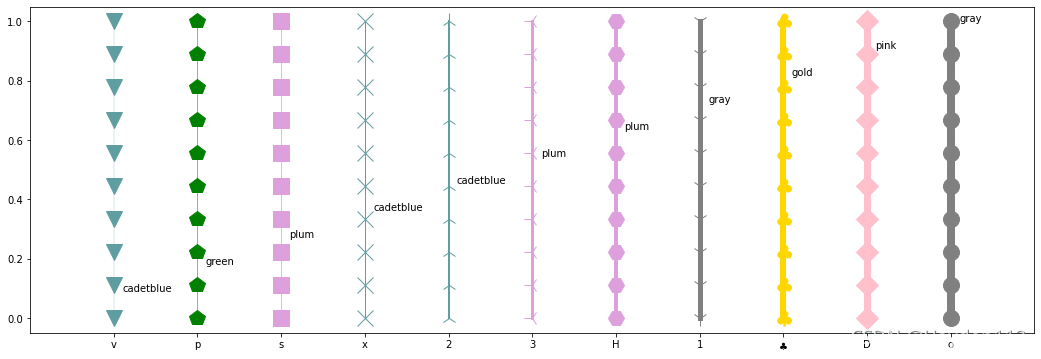
markers = ['.',',','o','v','^','<','>','1','2','3','4', 's','p','*','h','H','+','x','D','d','|','_', r'$\clubsuit$']
markers_slice = random.sample(markers, len(W))

fig = plt.figure(figsize=(18,6), dpi=72)
axes = plt.subplot(111)

for i,w,marker in zip(range(len(W)),W,markers_slice):
    color = random.choice(clist1)

#     展示不同的颜色和线宽
#     axes.plot( (1+i)*X, Y,color = color, linewidth = w,label = cnames2[color])

#     展示不同的样式
    axes.plot( (1+i)*X, Y,color = color, linewidth = w,marker = marker,markersize = 16, markeredgecolor = color, markerfacecolor = color,label = cnames2[color])

    plt.text(i+1.1,(i+1)/len(W),cnames2[color])


# legend设置图例的位置
# plt.legend(loc = 'upper left')                # 展示不同的颜色和线宽

lineNumbers = len(W)
# 设置图片边界
axes.set_xlim(0,lineNumbers+1)

# 设置轴记号
# axes.set_yticks([])
axes.set_xticks(np.arange(1,lineNumbers+1))
# 更改轴标记
# axes.set_xticklabels(['%.2f' % w for w in W])   # 展示不同的颜色和线宽
axes.set_xticklabels(markers_slice)

plt.show()
重新设置轴标记、移动坐标轴和标注旋转
import matplotlib.pyplot as plt
import numpy as np
%matplotlib inline

# 创建一个 10 * 6 点(point)的图,并设置分辨率为 80
plt.figure(figsize=(10,6), dpi=80)

X = np.linspace(-np.pi, np.pi, 256,endpoint=True)
C,S = np.cos(X), np.sin(X)

# label增加图例
plt.plot(X, C, color="#ADFF2F", linewidth=2.5, linestyle="-", label="cosine")
# color="red"
plt.plot(X, S, color="red",  linewidth=2.5, linestyle="-", label="sine")

# legend设置图例的位置
# axes.legend(loc='upper left')
plt.legend(loc='best')
# 设置图片边界
xmin ,xmax = X.min(), X.max()
ymin, ymax = C.min(), C.max()
dx = (xmax - xmin) * 0.2
dy = (ymax - ymin) * 0.2
plt.xlim(xmin - dx, xmax + dx)
plt.ylim(ymin - dy, ymax + dy)

# 设置轴名称和标题
plt.xlabel('x')
plt.ylabel('sine and cosine',color='red')
plt.title('test')

# # 设置轴记号
# plt.xticks([-np.pi, -np.pi/2, 0, np.pi/2, np.pi])
# plt.yticks([-1, 0, +1])
# 设置轴记号标签
plt.xticks([-np.pi, -np.pi/2, 0, np.pi/2, np.pi],[r'$-\pi$', r'$-\pi/2$', r'$0$', r'$+\pi/2$', r'$+\pi$'])
plt.yticks([-1, 0, +1],[r'$-1$', r'$0$', r'$+1$'])

# 旋转坐标轴标签
plt.xticks(rotation = 45)

# # 移动脊柱
# ax = plt.gca()
# ax.spines['right'].set_color('none')
# ax.spines['top'].set_color('none')
# ax.xaxis.set_ticks_position('bottom')
# ax.spines['bottom'].set_position(('data',0))
# ax.yaxis.set_ticks_position('left')
# ax.spines['left'].set_position(('data',0))

# for label in ax.get_xticklabels() + ax.get_yticklabels():
#     label.set_fontsize(16)
#     label.set_bbox(dict(facecolor='white', edgecolor='None', alpha=0.65 ))


# 以分辨率 72 来保存图片
plt.savefig("exercice_1.png",dpi=80)

# 在屏幕上显示
plt.show()

双坐标轴和y轴数据按百分比显示
import numpy as np
import matplotlib.pyplot as plt

x = np.arange(1, 21, 0.1)

y1 = x * x
y2 = np.log(x)

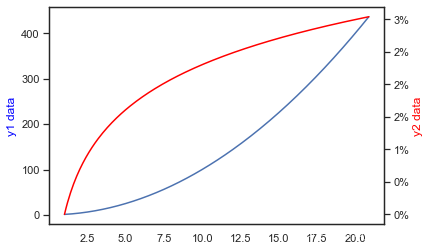
plt.plot(x, y1)
plt.ylabel('y1 data',color = 'blue')

# 添加一条坐标轴,y轴的
plt.twinx()
plt.plot(x, y2,color = 'red')
plt.ylabel('y2 data',color = 'red')

# y轴数据以%显示
def to_percent(temp, position):
    return '%1.0f'%(temp) + '%'
from matplotlib.ticker import FuncFormatter
plt.gca().yaxis.set_major_formatter(FuncFormatter(to_percent))

plt.show()
图中图和中文显示
import numpy as np
import matplotlib.pyplot as plt

plt.rcParams['font.family'] = ['sans-serif']
plt.rcParams['font.sans-serif'] = ['SimHei']  # 上两句一起设置显示中文
plt.rcParams['axes.unicode_minus'] = False    # 显示负号


#新建figure
fig = plt.figure()
# 定义数据
x = [1, 2, 3, 4, 5, 6, 7]
y = [1, 3, 4, 2, 5, 8, 6]
#新建区域ax1
#figure的百分比,从figure 10%的位置开始绘制, 宽高是figure的80%
left, bottom, width, height = 0.1, 0.1, 0.8, 0.8
# 获得绘制的句柄
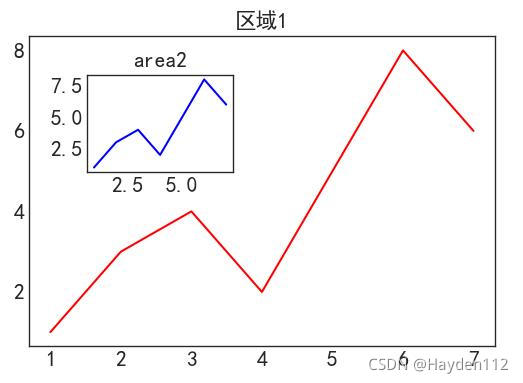
ax1 = fig.add_axes([left, bottom, width, height])
ax1.plot(x, y, 'r')
ax1.set_title('区域1')

#新增区域ax2,嵌套在ax1内
left, bottom, width, height = 0.2, 0.55, 0.25, 0.25
# 获得绘制的句柄
ax2 = fig.add_axes([left, bottom, width, height])
ax2.plot(x,y, 'b')
ax2.set_title('area2')
plt.show()
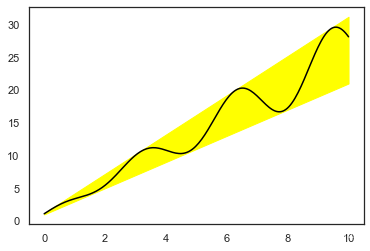
颜色填充
x = np.linspace(0, 10, 200)
data_obj = {'x': x,
            'y1': 2 * x + 1,
            'y2': 3 * x + 1.2,
            'mean': 0.5 * x * np.cos(2*x) + 2.5 * x + 1.1}

fig, ax = plt.subplots()

#填充两条线之间的颜色
ax.fill_between('x', 'y1', 'y2', color='yellow', data=data_obj)

# Plot the "centerline" with `plot`
ax.plot('x', 'mean', color='black', data=data_obj)

plt.show()
hist柱状图
柱状图用来展示数据(连续型)的分布或趋势变化。比如某企业员工的年龄分布情况。
柱状图和条形图区别
- 柱状图通常用来呈现变量的分布,而条形图通常用来比较鼻梁;
- 柱状图将数据按照一定的区间分组,而条形图将数据分类;
- 柱状图的柱之间一般是有空隙的,而条形图的条之间一般不能有空白;
- 柱状图的横轴是量化数据,而条形图的横轴是类别;
- 柱状图不同柱一般不能重新排序,而条形图不同条可以任意重新排序。
import matplotlib.pyplot as plt
%matplotlib inline
import numpy as np
np.random.seed(145)

fig, axes = plt.subplots(2, 2, figsize=(15, 9))
fig.subplots_adjust(wspace=0.5, hspace=0.3,left=0.125, right=0.9,top=0.9,    bottom=0.1)
ax0, ax1, ax2, ax3 = axes.flatten()
# fig.tight_layout() #自动调整布局,使标题之间不重叠
# fig.tight_layout()

n_bins = 15
x = np.random.randn(1000, 3)

colors = ['red', 'tan', 'lime']
ax0.hist(x, n_bins, density=True, histtype='bar', color=colors, label=colors)
ax0.legend(prop={'size': 10})
ax0.set_title('bars with legend')

ax1.hist(x, n_bins, density=True, histtype='barstacked')
ax1.set_title('stacked bar')

ax2.hist(x,  histtype='barstacked', rwidth=0.9)

ax3.hist(x[:, 0], rwidth=0.9)
ax3.set_title('different sample sizes')

plt.show()

bar条形图
条形图用来表达数据间(类别特征)的比较关系。比如某类产品里不同单品的销售情况。
import matplotlib.pyplot as plt
%matplotlib inline
import numpy as np
np.random.seed(145)

plt.figure(figsize=(10,6), dpi=80)
n = 12
X = np.arange(n)
Y1 = (1-X/float(n)) * np.random.uniform(0.5,1.0,n)
Y2 = (1-X/float(n)) * np.random.uniform(0.5,1.0,n)

plt.bar(X, +Y1, facecolor='#9999ff', edgecolor='white')
plt.bar(X, -Y2, facecolor='#ff9999', edgecolor='white')

for x,y in zip(X,Y1):
    plt.text(x, y+0.05, '%.2f' % y, ha='center', va= 'bottom')

for x,y in zip(X,-Y2):
    plt.text(x, y-0.1, '%.2f' % y, ha='center', va= 'bottom')

plt.ylim(-1,+1)
plt.show()

scatter散点图
import matplotlib.pyplot as plt
%matplotlib inline
import numpy as np
np.random.seed(145)

plt.figure(figsize=(10,6), dpi=80)

N = 200
x = np.random.rand(N)
y = np.random.rand(N)
colors = np.random.rand(N)
area = (30 * np.random.rand(N))**2

plt.scatter(x, y, s=area, c=colors, alpha=0.5)
plt.show()

散点图带边缘直方图hist
边缘直方图具有沿X和Y轴变量的直方图。这用于可视化X和Y之间的关系以及单独的X和Y的单变量分布。该图如果经常用于探索性数据分析(EDA)。
下面示例参考来源
import numpy as np
import pandas as pd
import matplotlib.pyplot as plt

n = 200
displ = np.random.normal(0, 1, n)
hwy = np.random.normal(0, 1, n)

colors = np.random.rand(n)

# Create Fig and gridspec
fig = plt.figure(figsize=(16, 10), dpi= 80)
grid = plt.GridSpec(4, 4, hspace=0.5, wspace=0.2)

# Define the axes
ax_main = fig.add_subplot(grid[:-1, :-1])
ax_right = fig.add_subplot(grid[:-1, -1], xticklabels=[], yticklabels=[])
ax_bottom = fig.add_subplot(grid[-1, 0:-1], xticklabels=[], yticklabels=[])

# Scatterplot on main ax
ax_main.scatter(displ, hwy, alpha=.9,  cmap="tab10", edgecolors='gray', linewidths=.5,c=colors)

# histogram on the right
ax_bottom.hist(displ, 40, histtype='stepfilled', orientation='vertical', color='deeppink')
ax_bottom.invert_yaxis()

# histogram in the bottom
ax_right.hist(hwy, 40, histtype='stepfilled', orientation='horizontal', color='deeppink')

# Decorations
ax_main.set(title='Scatterplot with Histograms displ vs hwy', xlabel='displ', ylabel='hwy')
ax_main.title.set_fontsize(20)
for item in ([ax_main.xaxis.label, ax_main.yaxis.label] + ax_main.get_xticklabels() + ax_main.get_yticklabels()):
    item.set_fontsize(14)

# xlabels = ax_main.get_xticks().tolist()
# ax_main.set_xticklabels(xlabels)
plt.show()

散点图带边缘箱形图boxplot
边缘箱图与边缘直方图具有相似的用途。然而,箱线图有助于精确定位X和Y的中位数,第25和第75百分位数。
import numpy as np
import pandas as pd
import matplotlib.pyplot as plt
import seaborn as sns

n = 200
displ = np.random.normal(0, 1, n)
hwy = np.random.normal(0, 1, n)

colors = np.random.rand(n)

# Create Fig and gridspec
fig = plt.figure(figsize=(16, 10), dpi= 80)
grid = plt.GridSpec(4, 4, hspace=0.5, wspace=0.2)

# Define the axes
ax_main = fig.add_subplot(grid[:-1, :-1])
ax_right = fig.add_subplot(grid[:-1, -1], xticklabels=[], yticklabels=[])
ax_bottom = fig.add_subplot(grid[-1, 0:-1], xticklabels=[], yticklabels=[])

# Scatterplot on main ax
ax_main.scatter(displ, hwy, alpha=.9,  cmap="tab10", edgecolors='gray', linewidths=.5,c=colors)

# Add a graph in each part
sns.boxplot(data=hwy, ax=ax_right, orient="Vertical")
sns.boxplot(data=displ, ax=ax_bottom, orient="h")


# Decorations ------------------
# Remove x axis name for the boxplot
ax_bottom.set(xlabel='')
ax_right.set(ylabel='')

# Main Title, Xlabel and YLabel
ax_main.set(title='Scatterplot with Histograms displ vs hwy', xlabel='displ', ylabel='hwy')

# Set font size of different components
ax_main.title.set_fontsize(20)
for item in ([ax_main.xaxis.label, ax_main.yaxis.label] + ax_main.get_xticklabels() + ax_main.get_yticklabels()):
    item.set_fontsize(14)
plt.show()

散点图带辅助线axhline/axvline
import numpy as np
import pandas as pd
import matplotlib.pyplot as plt
import seaborn as sns

n = 200
xx = np.random.normal(0, 1, n)
yy = np.random.normal(0, 1, n)

colors = np.random.rand(n)

fig = plt.figure(figsize=(10, 8), dpi= 80)
grid = plt.GridSpec(4, 4, hspace=0.5, wspace=0.2)
plt.scatter(xx, yy, alpha=.9,  cmap="tab10", edgecolors='gray', linewidths=.5,c=colors)

# 添加辅助线
plt.axhline(y = yy.mean() , color='purple' , linestyle='--')
plt.axvline(x =xx.mean() , color='purple' , linestyle='--')

plt.show();

boxplot箱形图
-
下限 = max(Q1-1.5IQR ,min)
-
四分位距离IQR = Q3 - Q1
-
下四分位数Q1
-
中位数Q2
-
上四分位数Q3
-
上限 = min(Q3+1.5IQR,max)
-
异常值:大于上限的值,或者小于下限的值
-
极端异常值,即超出四分位数差3倍距离的异常值,用实心点表示;较为温和的异常值,即处于1.5倍-3倍四分位数差之间的异常值,用空心点表示。
- 识别数据异常值
箱形图的绘制依靠实际数据,不需要事先假定数据服从特定的分布形式,没有对数据作任何限制性要求,它只是真实直观地表现数据形状的本来面貌;另一方面,箱形图判断异常值的标准以四分位数和四分位距为基础,四分位数具有一定的耐抗性,多达25%的数据可以变得任意远而不会很大地扰动四分位数,所以异常值不能对这个标准施加影响,箱形图识别异常值的结果比较客观。
-
判断数据偏态和尾重:根据须线与箱体位置来判断
-
比较几批数据的形状:同一数轴上,几批数据的箱形图并行排列,几批数据的中位数、尾长、异常值、分布区间等形状信息便昭然若揭。
sample_data = np.random.normal(0, 1, 200)
sample_data = list(sample_data)
sample_data.extend([1.5,3])
sns.boxplot(data= np.array(sample_data), orient="Vertical")
plt.show();

axes3d
from mpl_toolkits.mplot3d import axes3d
import numpy as np
import pandas as pd
import matplotlib.pyplot as plt
%matplotlib inline
%matplotlib notebook

#忽略一些版本不兼容等警告
import warnings
warnings.filterwarnings("ignore")


df_temp = pd.read_csv(r'250649.csv')
print (df_temp.shape)
# print (df_temp['no'].nunique())
# display (df_temp.head())

# n = 500
# x = np.random.normal(0, 1, n)
# y = np.random.normal(0, 1, n)
# z = np.random.normal(0, 1, n)

n = len(df_temp)
x = df_temp['age'].values
y = np.log(df_temp['total_net_asset'])
z = np.log(df_temp['sum_done_amt'])


x1 = df_temp[df_temp['no']==46000*****]['age'].values
y1 = np.log(df_temp[df_temp['no']==46000*****]['total_net_asset'])
z1 = np.log(df_temp[df_temp['no']==46000*****]['sum_done_amt'])
print (x1,y1,z1)

plt.figure('3D Scatter', facecolor='lightgray',figsize=(8,6))
ax3d = plt.gca(projection='3d')
d = (x - 0) ** 2 + (y - 0) ** 2 + (z - 0) ** 2
ax3d.set_xlabel('age', fontsize=12)
ax3d.set_ylabel('log_total_net_asset', fontsize=12)
ax3d.set_zlabel('log_sum_done_amt', fontsize=12)
ax3d.scatter(x, y, z, s=30, marker='o', alpha=0.6, c='green', cmap='jet')
ax3d.scatter(x1, y1, z1, s=80, marker='o', alpha=1, c='red', cmap='jet')

ax3d.elev = 20
ax3d.azim =-60
# ax3d.azim = -60
plt.tight_layout()
plt.show();

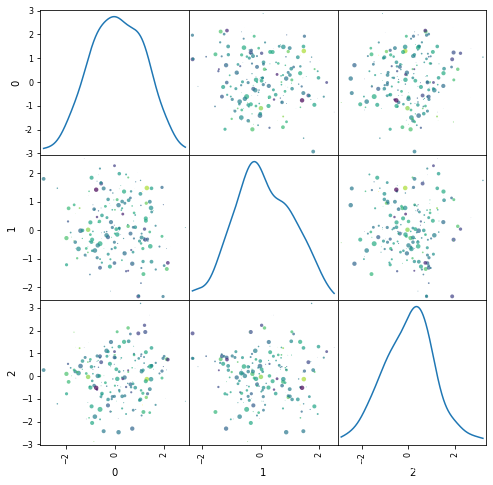
多变量样本的分布情况
scatter_matrix
import numpy as np
import pandas as pd
import matplotlib.pyplot as plt
# import seaborn as sns

# 多变量样本的分布情况
N = 200
X = np.random.normal(0,1,(N,3))
df_temp = pd.DataFrame(X)
# display (df_temp)
pd.plotting.scatter_matrix(df_temp, alpha=0.7,c=np.random.randn(N),s=(10 * np.random.rand(N))**2, figsize=(8,8), diagonal='kde')
# diagonal:({‘hist’, ‘kde’}),必须且只能在{‘hist’, ‘kde’}中选择1个,’hist’表示直方图(Histogram plot),’kde’表示核密度估计(Kernel Density Estimation);该参数是scatter_matrix函数的关键参数

# pd.plotting.scatter_matrix(df_temp, alpha=0.7,c=np.random.randn(N),s=(10 * np.random.rand(N))**2  , figsize=(12,12))
plt.show()
pairplot成对图
成对图是探索性分析中的最爱,以理解所有可能的数字变量对之间的关系。它是双变量分析的必备工具。
import numpy as np
import pandas as pd
import matplotlib.pyplot as plt
import seaborn as sns

# Load Dataset
df = sns.load_dataset('iris')

# Plot
# plt.figure(figsize=(10,8), dpi= 80)
sns.pairplot(df, kind="scatter", hue="Species", plot_kws=dict(s=80, edgecolor="white", linewidth=2.5))
# hue: 用一个特征来显示图像上的颜色,类似于打标签
plt.show();

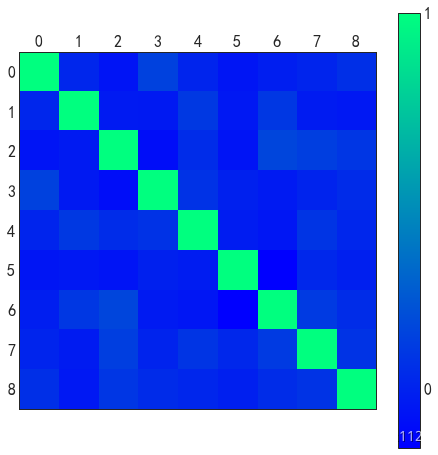
特征相关性
matshow
#  特征相关性显示
plt.figure(figsize=(8,8))
X = np.random.normal(0,1,(N,9))
cov = np.corrcoef(X.T)
img = plt.matshow(cov,cmap=plt.cm.winter,fignum=0)   # fignum=0才可以更改图形大小
plt.colorbar(img, ticks=[-1,0,1])
plt.show()
heatmap
N = 100
df = pd.DataFrame(np.random.normal(0,1,(N,9)),columns = list('ABCDEFGHI'))

# Plot
plt.figure(figsize=(10,8), dpi= 80)
sns.heatmap(df.corr(), xticklabels=df.corr().columns, yticklabels=df.corr().columns, cmap='RdYlGn', center=0, annot=True)
# annot: 默认为False,为True的话,会在格子上显示数字

# Decorations
plt.title('Correlogram of each features', fontsize=22)
plt.xticks(fontsize=12)
plt.yticks(fontsize=12)
plt.show()

Seaborn
正负样本在某个特征上的分布
def KdePlot(df,label,factor,flag=None,positive=10):
    import seaborn as sns
    import matplotlib.pyplot as plt

    # 设置核密度分布图
    plt.figure(figsize=(20,10))
    sns.set(style='white')
    if positive==1:
        df[factor] = np.abs(df[factor])
    else:
        pass
    if flag == 'log':
        x0 = np.log(df[df[label]==0][factor]+1)
        x1 = np.log(df[df[label]==1][factor]+1)
    else:
        x0 = df[df[label]==0][factor]
        x1 = df[df[label]==1][factor]

    sns.distplot(x0,
               color = 'blue',
               kde = True, # 绘制密度曲线
               hist = True, # 绘制直方图
               #rug = True, # rug图
               kde_kws = {'shade':True,'color':'green','facecolor':'green','label':'label_0'},
               rug_kws = {'color':'green','height':0.1,'alpha':0.1})
    plt.xlabel('%s'%factor,fontsize=40)
    plt.ylabel('label_0',fontsize = 30)
    plt.xticks(fontsize = 30)
    plt.yticks(fontsize = 30)
    plt.legend(loc='upper left',fontsize=30)

    plt.twinx()

    sns.distplot(x1,
               color = 'orange',
               kde = True, # 绘制密度曲线
               hist = True, # 绘制直方图
               #rug = True, # rug图
               kde_kws = {'shade':True,'color':'red','facecolor':'red','label':'label_1'},
               rug_kws = {'color':'red','height':0.1,'alpha':0.2})
#     plt.xlabel('%s'%factor,fontsize=40)
    plt.ylabel('label_1',fontsize = 30)
    plt.xticks(fontsize = 30)
    plt.yticks(fontsize = 30)
    plt.legend(loc='upper right',fontsize=30)
    plt.show()
import pandas as pd
import numpy as np
df_test1 = pd.DataFrame(np.random.normal(0,1,(100,2)),columns=['col1','label'])
df_test1['label'] = 0

df_test2 = pd.DataFrame(np.random.normal(3,1,(100,2)),columns=['col1','label'])
df_test2['label'] = 1

df_test = pd.concat([df_test1,df_test2])
print (df_test.shape)
display (df_test.head())

KdePlot(df_test,'label','col1')
(200, 2)
| col1 | label | |
|---|---|---|
| 0 | 0.454213 | 0 |
| 1 | 0.183708 | 0 |
| 2 | 0.631315 | 0 |
| 3 | -0.858097 | 0 |
| 4 | 0.002038 | 0 |

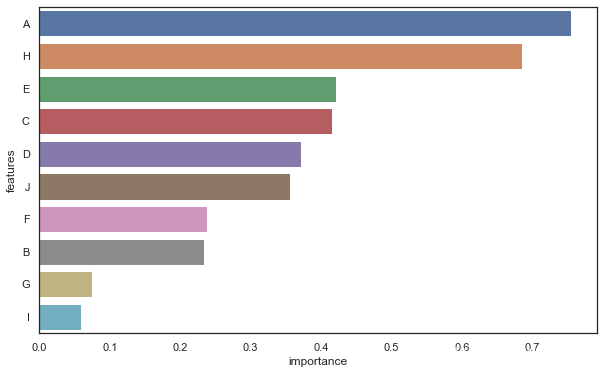
特征重要性
import seaborn as sns
import matplotlib.pyplot as plt

importance_df = pd.DataFrame(np.random.uniform(0,1,(10,2)),columns=['importance','features'])
importance_df['features'] = list('ABCDEFGHIJ')
importance_df = importance_df.sort_values('importance',ascending=False)

plt.figure(figsize=(10,6))
sns.barplot(importance_df['importance'][:10],importance_df['features'][:10])
plt.show()
机器学习评估指标
import numpy as np
import pandas as pd
import xgboost as xgb
from  sklearn import metrics
import itertools
from sklearn.model_selection import train_test_split

data_temp = pd.DataFrame(np.random.uniform(0,1,(1000,4)),columns=list('ABCD'))
data_temp['label'] = np.random.randint(0,2,1000)
print (data_temp['label'].value_counts())
print (data_temp.shape)
display (data_temp.head())
0    517
1    483
Name: label, dtype: int64
(1000, 5)
| A | B | C | D | label | |
|---|---|---|---|---|---|
| 0 | 0.443926 | 0.731970 | 0.122408 | 0.117941 | 0 |
| 1 | 0.099911 | 0.054038 | 0.473230 | 0.695794 | 0 |
| 2 | 0.603918 | 0.069061 | 0.595999 | 0.823504 | 1 |
| 3 | 0.647549 | 0.851167 | 0.223319 | 0.511646 | 0 |
| 4 | 0.487028 | 0.109147 | 0.260513 | 0.256178 | 1 |
train_df, val_df = train_test_split(data_temp,test_size=0.3)
print (train_df.shape)

train_x = train_df[list('ABCD')]
train_y = train_df['label']

val_x = val_df[list('ABCD')]
val_y = val_df['label']

print (train_x.shape)
display(train_x.head())
(700, 5)
(700, 4)
| A | B | C | D | |
|---|---|---|---|---|
| 729 | 0.219488 | 0.656695 | 0.847595 | 0.701147 |
| 944 | 0.259017 | 0.496062 | 0.532910 | 0.296195 |
| 438 | 0.797701 | 0.656008 | 0.687834 | 0.776919 |
| 162 | 0.599065 | 0.202716 | 0.910045 | 0.415183 |
| 426 | 0.779089 | 0.241461 | 0.538189 | 0.078710 |
train_x.describe().T
| count | mean | std | min | 25% | 50% | 75% | max | |
|---|---|---|---|---|---|---|---|---|
| A | 700.0 | 0.482569 | 0.286382 | 0.002671 | 0.229569 | 0.464319 | 0.717962 | 0.993493 |
| B | 700.0 | 0.508247 | 0.294342 | 0.003889 | 0.250605 | 0.497436 | 0.773453 | 0.998239 |
| C | 700.0 | 0.504852 | 0.292650 | 0.000754 | 0.241070 | 0.513298 | 0.759439 | 0.997507 |
| D | 700.0 | 0.494631 | 0.288516 | 0.001711 | 0.237663 | 0.486186 | 0.751890 | 0.999780 |
val_x.describe().T
| count | mean | std | min | 25% | 50% | 75% | max | |
|---|---|---|---|---|---|---|---|---|
| A | 300.0 | 0.501102 | 0.283084 | 0.000224 | 0.265790 | 0.501303 | 0.739708 | 0.994845 |
| B | 300.0 | 0.507088 | 0.291583 | 0.000504 | 0.246880 | 0.517363 | 0.760842 | 0.999664 |
| C | 300.0 | 0.497556 | 0.287549 | 0.005196 | 0.267911 | 0.492299 | 0.750864 | 0.997553 |
| D | 300.0 | 0.512048 | 0.304492 | 0.002724 | 0.241680 | 0.501633 | 0.781100 | 0.998337 |
# 模型参数设定
model = xgb.XGBClassifier(base_score=0.5, booster='gbtree', colsample_bylevel=1,
              colsample_bynode=1, colsample_bytree=1, gamma=0, gpu_id=-1,
              importance_type='gain', interaction_constraints='',
              learning_rate=0.1, max_delta_step=0, max_depth=4,
              min_child_weight=1, monotone_constraints='()',
              n_estimators=10, n_jobs=0, num_parallel_tree=1, random_state=0,
              reg_alpha=0, reg_lambda=1, scale_pos_weight=1, subsample=1,
              tree_method='exact', validate_parameters=1, verbosity=None)
model.fit(train_x, train_y,eval_set=[(train_x,train_y),(val_x,val_y)],eval_metric=['error'],early_stopping_rounds=5,verbose=True)
[0]	validation_0-error:0.39714	validation_1-error:0.51000
[1]	validation_0-error:0.35571	validation_1-error:0.50333
[2]	validation_0-error:0.32286	validation_1-error:0.49667
[3]	validation_0-error:0.32286	validation_1-error:0.49333
[4]	validation_0-error:0.32857	validation_1-error:0.50000
[5]	validation_0-error:0.31143	validation_1-error:0.49000
[6]	validation_0-error:0.30000	validation_1-error:0.50333
[7]	validation_0-error:0.30000	validation_1-error:0.51333
[8]	validation_0-error:0.28714	validation_1-error:0.51000
[9]	validation_0-error:0.28286	validation_1-error:0.50667


XGBClassifier(base_score=0.5, booster='gbtree', colsample_bylevel=1,
              colsample_bynode=1, colsample_bytree=1, gamma=0, gpu_id=-1,
              importance_type='gain', interaction_constraints='',
              learning_rate=0.1, max_delta_step=0, max_depth=4,
              min_child_weight=1, missing=nan, monotone_constraints='()',
              n_estimators=10, n_jobs=0, num_parallel_tree=1, random_state=0,
              reg_alpha=0, reg_lambda=1, scale_pos_weight=1, subsample=1,
              tree_method='exact', validate_parameters=1, verbosity=None)
随机构造的数据,所以在训练集上误差较小,在验证集上误差较大,即模型产生了过拟合
混淆矩阵、召回率和精确率
真实评估时以验证集为准
def plot_confusion_matrix(cm, classes, title='Confusion matrix', cmap=plt.cm.Blues):
    plt.imshow(cm, interpolation='nearest', cmap=cmap)
    plt.title(title)
    tick_marks = np.arange(len(classes))
    plt.xticks(tick_marks, classes)
    plt.yticks(tick_marks, classes)

    thresh = cm.max()/2
#     print (thresh)
#     print (cm)
    for i,j in itertools.product(range(cm.shape[0]), range(cm.shape[0])):
        plt.text(j,i,cm[i,j], horizontalalignment='center',color='red' if cm[i,j]>thresh else 'black')
        plt.tight_layout()
        plt.ylabel('True label')
        plt.xlabel('Predicted label')

def matrixs_plot(X_test, y_test, clf, thresh=0.5, png_savename=0):
    plt.figure(figsize=(10,6))
    y_pre = clf.predict(X_test)
    y_score = clf.predict_proba(X_test)[:,1]

    y_prediction = y_score>=thresh  # 多少概率以上的设定为正
    cnf_matrix = metrics.confusion_matrix(y_test, y_prediction)
    np.set_printoptions(precision=2) #设置浮点进度
    vali_recall = '{0:.3f}'.format(cnf_matrix[1,1]/(cnf_matrix[1,0]+cnf_matrix[1,1]))
    vali_precision = '{0:.3f}'.format(cnf_matrix[1,1]/(cnf_matrix[0,1]+cnf_matrix[1,1]))
    class_names = [0,1]
    title = 'Recall=%s%% \n Precision=%s%%'%('{0:.1f}'.format(float(vali_recall)*100),'{0:.1f}'.format(float(vali_precision)*100))
    plot_confusion_matrix(cnf_matrix, classes=class_names, title=title)

    plt.xlabel('Predict label')
    plt.ylabel('True label')
    if png_savename!=0:
        plt.savefig('pic/%s_混淆矩阵.png'%png_savename,dpi=300)
y_val = val_y
y_pre = model.predict(val_x)
tn, fp, fn, tp = metrics.confusion_matrix(y_val, y_pre).ravel()
print ('Recall is :',round(tp/(tp+fn),3))
print ('Precision is :',round(tp/(tp+fp),3))
print('matrix    label0  label1')
print('predict0  {:<6d}  {:<6d}'.format(int(tn), int(fn)))
print('predict1  {:<6d}  {:<6d}'.format(int(fp), int(tp)))
Recall is : 0.49
Precision is : 0.493
matrix    label0  label1
predict0  82      74
predict1  73      71
matrixs_plot(val_x,val_y,model,thresh=0.5)

AUC
def auc_plot(X_test, y_test, clf, png_savename=0):
    from sklearn.metrics import auc,roc_curve, accuracy_score

    plt.figure(figsize=(10,6))
    y_pre = clf.predict(X_test)
    y_score = clf.predict_proba(X_test)[:,1]  # 输出预测的概率
    fpr, tpr, thresholds = roc_curve(y_test, y_score)
    thresholds = np.clip(thresholds,0,1)
    roc_auc = auc(fpr, tpr)  # 计算AUC
    # 画出AUC
    plt.plot(fpr, tpr, color='blue',label="AUC = {0:.4f}".format(roc_auc), ms=100)
    plt.xlabel('FPR', fontsize=15)
    plt.ylabel('TPR', fontsize=15)
    plt.legend(loc='center left')

    # 画出thresholds
    plt.twiny()
    plt.plot(thresholds,tpr,color='green',label='thresholds')
    plt.xlabel('thresholds', fontsize=15)

    # 画出对角线
    plt.plot([0, 1], [0, 1], 'r--')

    plt.title("ROC curve", fontsize=20)
    plt.legend(loc='center right')

    if png_savename != 0:
        plt.savefig("%s_AUC.png" % png_savename)  # 保存AUC图
    plt.show()
    print("Accuracy: {0:.2f}".format(accuracy_score(y_test, y_pre)))
真实评估时以验证集为准
auc_plot(val_x, val_y, model, png_savename=0)

Accuracy: 0.51
auc_plot(train_x, train_y, model, png_savename=0)

Accuracy: 0.69
KS
def metrics_ks(X_test, y_test, clf):
    """
    功能: 计算模型性能指标:ks, 找到最佳threshold值
    X_test:测试数据集x
    y_test: 测试数据集y
    clf:训练好的模型
    return:
        ks
        ks_threshold
    """
    from sklearn.metrics import auc,roc_curve
    import matplotlib.pyplot as plt

    plt.figure(figsize=(10,6))
    y_pre = clf.predict(X_test)
    y_score = clf.predict_proba(X_test)[:,1]  # 输出预测的概率
    fpr, tpr, thresholds = roc_curve(y_test, y_score, pos_label=1)
    thresholds = np.clip(thresholds,0,1)

    ks = abs(fpr - tpr).max()
    tmp = abs(fpr - tpr)
    index_ks = np.where(tmp==ks)     # np.where: 返回符合条件的下标函数
#     print (np.argwhere(tmp == ks)[0,0])
#     print (index_ks[0][0])
    ks_threshold = thresholds[index_ks][0]

#     x_curve = range(len(thresholds))
#     plt.plot(x_curve,fpr,label='bad',linewidth=2,color='r')
    plt.plot(fpr,label='bad',linewidth=2,color='r')
    plt.plot(tpr,label='good',linewidth=2,color='green')
    plt.plot(tmp,label='diff',linewidth=2,color='orange')
    # 标记KS
    bad_point = fpr[index_ks][0]
    good_point = tpr[index_ks][0]
    x_point = [index_ks[0][0],index_ks[0][0]]
    y_point = [bad_point,good_point]
    plt.plot(x_point,y_point,label='ks - {:.2f}'.format(ks),color='purple',marker='o',markersize=5)
    plt.scatter(x_point,y_point,color='purple')
    plt.title("KS curve", fontsize=20)
    plt.xlabel('Number', fontsize=15)
    plt.ylabel('FPR&TPR', fontsize=15)
    plt.legend()
    plt.show()
    print("ks value: {0:.2f}".format(ks))
    print("ks_threshold: {0:.2f}".format(ks_threshold))
    return ks, ks_threshold
真实评估时以验证集为准
metrics_ks(val_x, val_y, model)

ks value: 0.09
ks_threshold: 0.49


(0.08921023359288105, 0.49046585)
metrics_ks(train_x, train_y, model)

ks value: 0.39
ks_threshold: 0.50


(0.385115488908491, 0.4992057)
