import numpy as np
import pandas as pd
import matplotlib
import matplotlib.pyplot as plt
import seaborn as sns
%matplotlib inline
df = pd.read_csv('./earphone_sentiment.csv',encoding='utf-8')
df.head()
| content_id | content | subject | sentiment_word | sentiment_value | |
|---|---|---|---|---|---|
| 0 | 0 | Silent Angel期待您的光临,共赏美好的声音! | 其他 | 好 | 1 |
| 1 | 2 | 这只HD650在1k的失真左声道是右声道的6倍左右,也超出官方规格参数范围(0.05%),看... | 其他 | NaN | 0 |
| 2 | 3 | 达音科 17周年 倒是数据最好看,而且便宜 | 配置 | 好 | 1 |
| 3 | 4 | bose,beats,apple的消費者根本不知道有曲線的存在 | 其他 | NaN | 0 |
| 4 | 5 | 不错的数据 | 配置 | 不错 | 1 |
df.info()
<class 'pandas.core.frame.DataFrame'>
RangeIndex: 17176 entries, 0 to 17175
Data columns (total 5 columns):
 #   Column           Non-Null Count  Dtype
---  ------           --------------  -----
 0   content_id       17176 non-null  int64
 1   content          17176 non-null  object
 2   subject          17176 non-null  object
 3   sentiment_word   4966 non-null   object
 4   sentiment_value  17176 non-null  int64
dtypes: int64(2), object(3)
memory usage: 671.1+ KB
df['subject'].unique()
array(['其他', '配置', '价格', '功能', '音质', '舒适', '外形'], dtype=object)
df['sentiment_value'].unique()
array([ 1, 0, -1])
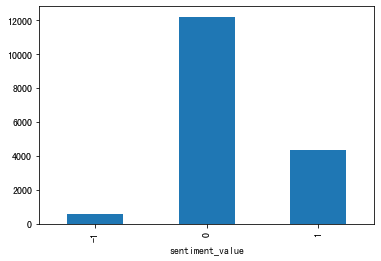
#观察标签分布
df.groupby('sentiment_value').size().plot.bar()
#大部分中性,好评比差评要多
<AxesSubplot:xlabel='sentiment_value'>

import jieba
words=df.content.apply(lambda t:list(jieba.cut(t)))
words[0]
['Silent', ' ', 'Angel', '期待', '您', '的', '光临', ',', '共赏', '美好', '的', '声音', '!']
#去掉标点,英文
def clean_text(value):
    import re
    if value:
        text="".join(re.findall(r"[\u4e00-\u9fff]+", value))
        return text if len(text)>0 else None
    else:
        return None
df.content[2]
'达音科 17周年 倒是数据最好看,而且便宜'
# 测试清洗效果
print("Before Cleaning: %s" % df.content[2])
print("After Cleaning: %s" % clean_text(df.content[2]))
print("Tokenize after cleaning: %s" % ", ".join(jieba.cut(clean_text(df.content[2]))))
Before Cleaning: 达音科 17周年 倒是数据最好看,而且便宜
After Cleaning: 达音科周年倒是数据最好看而且便宜
Tokenize after cleaning: 达音科, 周年, 倒, 是, 数据, 最, 好看, 而且, 便宜
df['text_clean']=df.content.apply(lambda t:clean_text(t))
df.text_clean.isnull().sum()
333
#None会报错,替换成停词‘的’,后边会过滤掉
words_clean=df.text_clean.apply(lambda t:list(jieba.cut(t)) if t is not None else '的')
words_clean[:10]
0                        [期待, 您, 的, 光临, 共赏, 美好, 的, 声音]
1    [这, 只, 在, 的, 失真, 左声道, 是, 右声道, 的, 倍, 左右, 也, 超出,...
2                   [达音科, 周年, 倒, 是, 数据, 最, 好看, 而且, 便宜]
3                      [的, 消費者, 根本, 不, 知道, 有曲線, 的, 存在]
4                                          [不错, 的, 数据]
5    [我, 觉得, 任何人, 都, 可以, 明确, 分别, 高端, 耳机, 之间, 的, 区别,...
6    [听, 出, 区别, 是, 一方面, 听, 出, 高低, 的, 层次, 要求, 就, 更, ...
7            [有没有, 人能, 从条, 电源线, 里, 听, 出, 最贵, 的, 是, 哪条]
8                                 [二级, 银, 耳朵, 对号入座, 下]
9    [一般来说, 所谓, 发烧友, 起步, 应该, 是, 铜, 耳朵, 这个, 级别, 达, 不...
Name: text_clean, dtype: object
#去掉停词
def stopwordslist(filepath):
    stopwords=set([line.strip() for line in open(filepath,'r',encoding='utf-8').readlines()])
    return stopwords
stop_words_cn=stopwordslist('cn_stop_words.txt')
words_final=[list(filter(lambda w:w not in stop_words_cn,words)) for words in words_clean]
#统计
from collections import Counter
word_freq = Counter([w for words in words_final for w in words])
word_freq_df = pd.DataFrame(word_freq.items())
word_freq_df.columns = ['word', 'count']
word_freq_df.sort_values('count', ascending=0).head(10)
| word | count | |
|---|---|---|
| 44 | 听 | 1946 |
| 33 | 耳机 | 1785 |
| 4 | 声音 | 1242 |
| 385 | 没 | 1053 |
| 332 | 买 | 898 |
| 758 | 说 | 825 |
| 187 | 没有 | 789 |
| 369 | 感觉 | 786 |
| 478 | 推 | 783 |
| 591 | 一个 | 783 |
top_K=100
word_freq_dict=dict(list(word_freq_df.sort_values('count',ascending=0).head(top_K).apply(lambda row: (row['word'],row['count']), axis=1)))
list(word_freq_dict.items())[:10]
[('听', 1946),
 ('耳机', 1785),
 ('声音', 1242),
 ('没', 1053),
 ('买', 898),
 ('说', 825),
 ('没有', 789),
 ('感觉', 786),
 ('推', 783),
 ('一个', 783)]
# 产生词云
from wordcloud import WordCloud
import matplotlib.pyplot as plt
plt.rcParams['figure.figsize'] = (16,8)
wc = WordCloud(font_path='SimHei.ttf',
               background_color="white",
               max_words = 2000)
wc.generate_from_frequencies(word_freq_dict)

# 显示词云
plt.imshow(wc)
plt.axis("off")
plt.figure(figsize=(16,8), dpi=1000)
plt.show()

<Figure size 16000x8000 with 0 Axes>
#词云和数据给出的结论一直,耳机的评论是正面的,但需要查看中性和负面评论的原因
def plot(value,top_K):
    comment=df[df['sentiment_value']==value]
    comment=comment['content'].apply(lambda x : list(jieba.cut(x)))
    words_final=[list(filter(lambda w:w not in stop_words_cn,words)) for words in comment]
    word_freq = Counter([w for words in words_final for w in words])
    word_freq_df = pd.DataFrame(word_freq.items())
    word_freq_df.columns = ['word', 'count']
    word_freq_dict=dict(list(word_freq_df.sort_values('count',ascending=0).head(top_K).apply(lambda row: (row['word'],row['count']), axis=1)))
    wc.generate_from_frequencies(word_freq_dict)
    # 显示词云
    plt.imshow(wc)
    plt.axis("off")
    plt.figure(figsize=(16,8), dpi=1000)
    plt.show()
#差评词云
plot(-1,100)
#关键词‘差异’,‘差距’,‘差别’,需要找到和谁的差别差距,竞品是谁
#关键词‘噪音’,‘低频’,‘高频’,’输出‘
#关键词’价格‘ 也是一个因素

<Figure size 16000x8000 with 0 Axes>
#中性词云
plot(0,100)

<Figure size 16000x8000 with 0 Axes>
#好评词云
plot(1,100)
#受好评的点,’解码‘,’平衡‘,’低频‘

<Figure size 16000x8000 with 0 Axes>
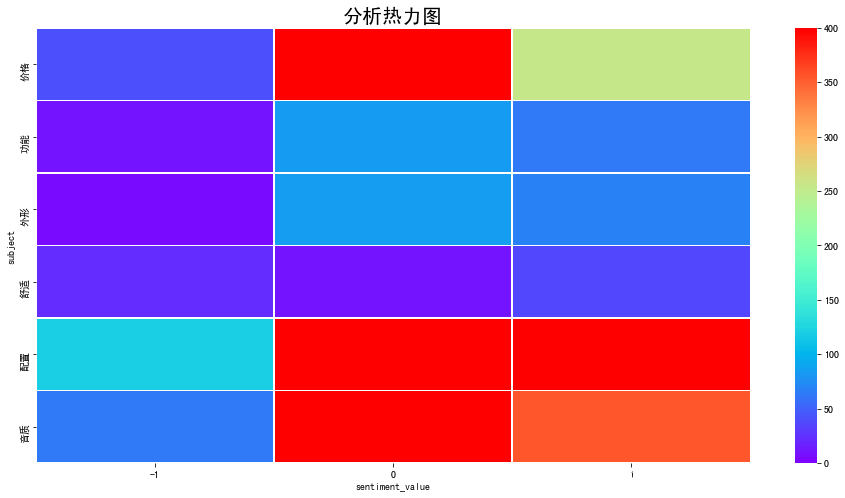
#相关性热力图
data_corr=df.pivot_table(columns='sentiment_value',index='subject',values='content',aggfunc="count").drop("其他")
ax=sns.heatmap(data_corr,cmap='rainbow', vmax=400,vmin=0,annot=False,linewidths=0.8,fmt='4g')
ax.set_title('分析热力图', fontsize = 20)
#正面评价更多跟‘配置’,‘音质’,‘价格’相关
#负面评价比较均衡,各方面原因都有

基于Logistic Regression的分类器训练
import jieba.analyse
test_sentence = df.text_clean[1]
test_sentence
'这只在的失真左声道是右声道的倍左右也超出官方规格参数范围看来是坏了'
jieba.analyse.extract_tags(test_sentence, topK=5, withWeight=False, allowPOS=())
['左声道', '右声道', '失真', '规格', '官方']
# 将关键词通过分隔符链接起来
df=df[pd.notnull(df['text_clean'])]
keywords_text = df.apply(lambda r: '|'.join([w for w in jieba.analyse.extract_tags(r['text_clean'], topK=5, withWeight=False, allowPOS=()) if w not in stop_words_cn]), axis=1).tolist()
keywords_text[:2]
['共赏|光临|美好|期待|声音', '左声道|右声道|失真|规格|官方']
# 构造CountVectorizer
from sklearn.feature_extraction.text import CountVectorizer
vectorizer = CountVectorizer(max_features=1000, analyzer='word', tokenizer=lambda s: s.split("|"))
bow = vectorizer.fit_transform(keywords_text)
feature_name = vectorizer.get_feature_names()
feature_name[:10]
['', '一下', '一个', '一代', '一体机', '一分货', '一只', '一台', '一堆', '一套']
#测试集合只标记了30多个长文本,有明显倾向的,后续发现这么做有坑,大部分是无情感倾向的
train_data = pd.read_csv('training.csv')
train_data.head()
| contnt | ntmnt_vlu | |
|---|---|---|
| 0 | 这个牌子还活着啊用过他家声音干冷硬非常难听 | -1 |
| 1 | 玩过一段时间6t感觉特色是有的态度也还诚恳审美品位审美的相对平庸但作为国货总体说得过去只是相... | 1 |
| 2 | 同意凤凰观点一般用用界面就很好了光纤只有理论上的高度实际效果只有呵呵 | -1 |
| 3 | 老实说这原线也是拖后腿的太糊了 | -1 |
| 4 | 现在的人听歌有没有感情都看器材了吗 | 0 |
bow
<16843x1000 sparse matrix of type '<class 'numpy.int64'>'
	with 34537 stored elements in Compressed Sparse Row format>
from sklearn.datasets import load_iris
from sklearn.linear_model import LogisticRegression
X, y = load_iris(return_X_y=True)
clf = LogisticRegression(random_state=0, solver='lbfgs', multi_class='multinomial').fit(X, y)
/opt/anaconda3/lib/python3.8/site-packages/sklearn/linear_model/_logistic.py:763: ConvergenceWarning: lbfgs failed to converge (status=1):
STOP: TOTAL NO. of ITERATIONS REACHED LIMIT.

Increase the number of iterations (max_iter) or scale the data as shown in:
    https://scikit-learn.org/stable/modules/preprocessing.html
Please also refer to the documentation for alternative solver options:
    https://scikit-learn.org/stable/modules/linear_model.html#logistic-regression
  n_iter_i = _check_optimize_result(
y = train_data.ntmnt_vlu
X = bow[:len(y), :]
clf = LogisticRegression(random_state=0, solver='lbfgs', multi_class='multinomial').fit(X, y)
clf.score(X, y)
0.967741935483871
# 测试一下预测的效果
idx_target = 1000
print("Sample Weibo: ", df.text_clean[idx_target])
print("Predicted Sentiment: ", clf.predict(bow[idx_target, :]))
Sample Weibo:  听人声怎么样
Predicted Sentiment:  [1]
#对比一下文本给出的倾向和预测值,惨不忍睹,一是因为测试集小,二是测试集里0值少
clf.score(bow[:, :], df['sentiment_value'])
0.22127886956005463
# 训练一个贝叶斯分类器
bayes_X = list(map(lambda s: {k: True for k in s.split("|")}, keywords_text[:len(y)]))
bayes_featuresets = list(zip(bayes_X, y))
# 训练分类器
from nltk.tokenize import word_tokenize
import nltk
classifier = nltk.NaiveBayesClassifier.train(bayes_featuresets)
classifier.show_most_informative_features()
# 没有特别明显的情绪词汇
Most Informative Features
                      耳朵 = None                0 : 1      =      1.3 : 1.0
                      期待 = None                1 : -1     =      1.3 : 1.0
                      搜索 = None                1 : 0      =      1.2 : 1.0
                      问题 = None                1 : 0      =      1.2 : 1.0
                      级别 = None                0 : 1      =      1.2 : 1.0
                         = None                1 : -1     =      1.1 : 1.0
                    一般来说 = None                1 : -1     =      1.1 : 1.0
                      互通 = None                1 : -1     =      1.1 : 1.0
                      佩戴 = None                1 : -1     =      1.1 : 1.0
                      便宜 = None                1 : -1     =      1.1 : 1.0
# 分类结果。0代表是中性的
test_sentence_features = keywords_text[100]
classifier.classify({k: True for k in test_sentence_features.split("|")})
1
keywords_text[100]
'听不出|绿灯|统统|反正|区别'
# 基于这个结果给所有的评价打上情感倾向,再统计一下分布
sentiment_values = clf.predict(bow)
# 可视化
from collections import Counter
sentiment_dist = Counter(sentiment_values)
sentiment_dist
Counter({-1: 2153, 1: 13713, 0: 977})
sentiment_dist_df = pd.DataFrame(sentiment_dist.items())
sentiment_dist_df.columns = ['Sentiment_Value', 'Count']
sentiment_dist_df = sentiment_dist_df.set_index('Sentiment_Value')
sentiment_dist_df.plot.bar()
#0标签大大减少了,训练结果跟测试集高度相关
<AxesSubplot:xlabel='Sentiment_Value'>
