前言
- 这篇文章来源于datashader一个官方的示例,原文地址https://examples.pyviz.org/census/census.html,这个notebook算是将其复现了一下(有些小改动);
- 数据集可以访问https://www.heywhale.com/mw/dataset/61569b59b97cc600181fe0c1/file进行下载。
- 整个项目依赖模块较多,而且对于版本有些限制,可以参考我的环境信息:

模块导入
import datashader as ds
import datashader.transfer_functions as tf
import pandas as pd
import colorcet
from IPython.display import Image

import  warnings
warnings.filterwarnings("ignore")
读取数据
- 数据是以Parquet存储的,Parquet 是 Hadoop 生态圈中主流的列式存储格式;
- 可以通过
pandas.read_parquet进行数据读取,pandas中可以选择pyarrow和fastparquet两种读取引擎,都需要安装额外的模块才能使用,经过对比,推荐使用fastparquet,读取速度更快,内存占用也会低一些;
%%time
df = pd.read_parquet('/home/mw/input/census2270/census2010.parq/census2010.parq', engine='fastparquet')

"""
CPU times: user 2.99 s, sys: 1.4 s, total: 4.39 s
Wall time: 4.42 s
"""
- 原始数据集中northing,easting是WebMercator信息,通过如下方法转为经纬度数据;
import math

def webMercator2LngLat(y):
    lat = y / 20037508.34 * 180
    lat = 180 / math.pi * \
            (2 * math.atan(math.exp(lat * math.pi / 180)) - math.pi / 2)
    return lat
- 这一步会非常耗时,且内存占用很高,如果你的电脑内存低于16G建议不要轻易尝试;
%%time
df.easting = df.easting / 20037508.34 * 180
df.northing = df.northing.apply(webMercator2LngLat)
df.columns = ['lon', 'lat', 'race']

"""
CPU times: user 4min 1s, sys: 13.8 s, total: 4min 15s
Wall time: 4min 15s
"""
- 数据集字段中race代表人种(w表示是白人,b表示是黑人,a表示为亚洲人,h表示拉丁裔,o表示其他);
| lon | lat | race | |
|---|---|---|---|
| 0 | -111.559685 | 31.496704 | h |
| 1 | -111.557396 | 31.494548 | h |
| 2 | -111.554993 | 31.497926 | h |
| 3 | -111.550125 | 31.498326 | w |
| 4 | -111.553864 | 31.494439 | h |
- 导出与展示的配置信息;
- 生成的图片会直接在notebook中进行渲染展示,同时在project/export文件夹下会保存一份图片;
- 注意这个是在jupyter notebook中使用的代码;
from IPython.core.display import HTML, display
from datashader.utils import export_image
from functools import partial

background='black'
export = partial(export_image, background = background, export_path="export")
display(HTML("<style>.container { width:100% !important; }</style>"))
- 各个区域的经纬度边界信息,用于后期数据的筛选与定位;
USA           = ((-124.72,  -66.95), (23.55, 50.06))
LakeMichigan  = (( -91.68,  -83.97), (40.75, 44.08))
Chicago       = (( -88.29,  -87.30), (41.57, 42.00))
Chinatown     = (( -87.67,  -87.63), (41.84, 41.86))
NewYorkCity   = (( -74.39,  -73.44), (40.51, 40.91))
LosAngeles    = ((-118.53, -117.81), (33.63, 33.96))
Houston       = (( -96.05,  -94.68), (29.45, 30.11))
Austin        = (( -97.91,  -97.52), (30.17, 30.37))
NewOrleans    = (( -90.37,  -89.89), (29.82, 30.05))
Atlanta       = (( -84.88,  -84.04), (33.45, 33.84))
- 定义导出图片的长宽信息;
width, height = 1000, 600
- 用于从原始数据集中筛选出对应区域的函数,考虑后期会多次复用,所以这边将其定义为一个函数;
def area_filter(longitude, latitude):
    dd = df[(df.lon.between(*longitude)) & (df.lat.between(*latitude))]
    return dd
第一个例子
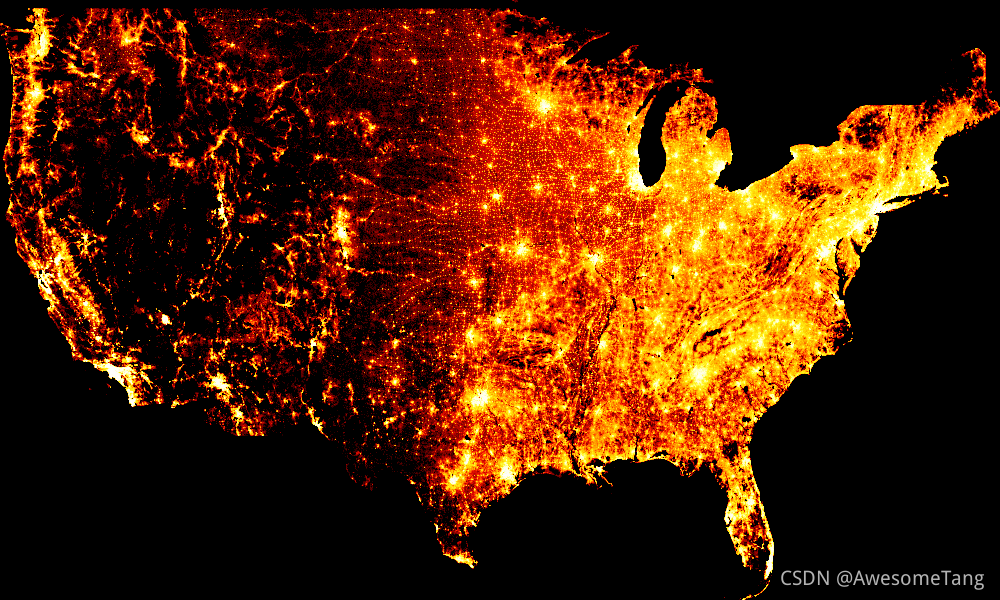
- 筛选出美国本土的位置数据,聚合之后会变成一个1000*600(前文中定义的图片的长宽)的二维数组(代码中的
agg)
dd = area_filter(*USA)
cvs = ds.Canvas(plot_width=width, plot_height=height)
agg = cvs.points(dd, y='lat', x='lon').fillna(0)
- 将agg根据数据值映射成不同的颜色,生成图片;
export(tf.shade(agg, cmap=colorcet.fire),"USA_fire")

linear
采用线性映射,不过由于不同地域之间人口密度差距太大,采用线性映射的时候大部分区域映射的颜色都是接近黑色了,整体图片也能看到几个小亮点;
export(tf.shade(agg, cmap=colorcet.fire, how='linear'),"USA_fire_linear")

log
export(tf.shade(agg, cmap=colorcet.fire, how='log'),"USA_fire_log")\

eq_hist
- 这个也是
tf.shade中的默认方式;
export(tf.shade(agg, cmap=colorcet.fire, how='eq_hist'),"USA_fire_eq_hist")

- 如果我们想要显示更多的细节,可以通过
colormap_select舍弃掉前20%的颜色(接近黑色部分),对比上图,可以看到整体会亮了很多;
from datashader.colors import colormap_select

export(tf.shade(agg, colormap_select(colorcet.fire, 0.2)),"USA_fire_eq_hist")

datashader中本身也有很多配色方案;
from datashader.colors import viridis

export(tf.shade(agg, cmap=colormap_select(viridis, 0.2)),"census_viridis_eq_hist")

我们也可以使用matplotlib中的配色方案
from matplotlib.cm import magma

export(tf.shade(agg, magma),"USA_mpl")

人种分布
前文提到了数据集中还包含对应的人种信息,我们根据不同的人种对各个像素点进行染色;
美国整体
青色对应白人,绿色的是黑人,红色是亚裔,紫色是拉丁裔,黄色是印第安人;
color_key = {'w':'aqua', 'b':'lime',  'a':'red', 'h':'fuchsia', 'o':'yellow' }

def creat_image(area):
    dd = area_filter(*area)
    cvs = ds.Canvas(plot_width=width, plot_height=height)
    agg = cvs.points(dd, 'lon', 'lat', ds.count_cat('race'))
    img = tf.shade(agg, color_key=color_key, how='eq_hist')
    return img
export(creat_image(USA), "USA-race")

- 看下不同区域的人种分布情况;
密西根湖
export(creat_image(LakeMichigan), "LakeMichigan")

芝加哥
export(creat_image(Chicago), "Chicago")

纽约
export(creat_image(NewYorkCity), "NewYorkCity")

洛杉矶
export(creat_image(LosAngeles), "LosAngeles")

休斯顿
export(creat_image(Houston), "Houston")

奥斯汀
export(creat_image(Austin), "Austin")

新奥尔良
export(creat_image(NewOrleans), "NewOrleans")

亚特兰大
export(creat_image(Atlanta), "Atlanta")
