一、基本介绍
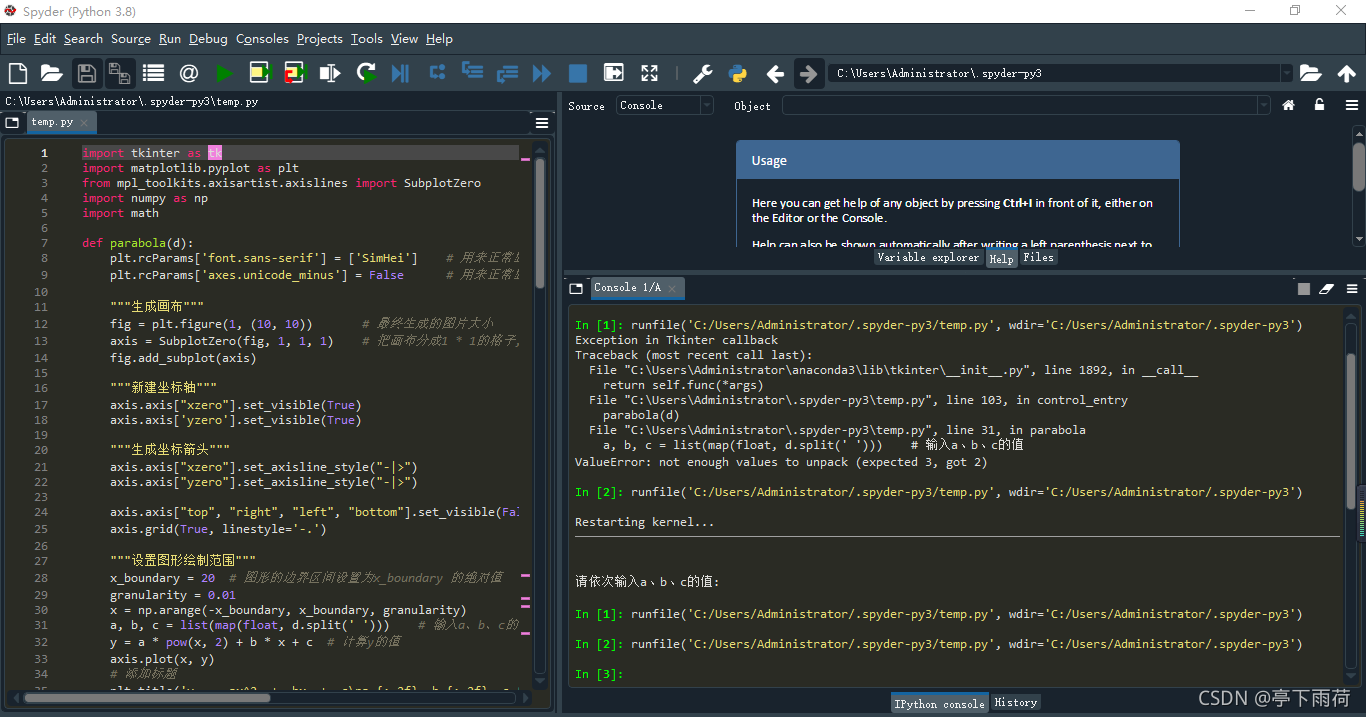
1.使用的python开发工具是Anaconda中的Spyder

这个工具比较好用,安装步骤直接百度即可。
2.原始代码用到了几个库,用到了matplotlib库等,百度添加相应的库即可。
3.原始代码的主要流程:main函数------>生成界面------>点击按钮调用输入函数------->调用一元二次方程代码函数。
二、具体代码
这样就得到了图形界面与代码的结合。
import tkinter as tk
import matplotlib.pyplot as plt
from mpl_toolkits.axisartist.axislines import SubplotZero
import numpy as np
import math

def parabola(d):
    plt.rcParams['font.sans-serif'] = ['SimHei']    # 用来正常显示中文标签
    plt.rcParams['axes.unicode_minus'] = False      # 用来正常显示负号

    """生成画布"""
    fig = plt.figure(1, (10, 10))       # 最终生成的图片大小
    axis = SubplotZero(fig, 1, 1, 1)    # 把画布分成1 * 1的格子, 把图形放在第1格
    fig.add_subplot(axis)

    """新建坐标轴"""
    axis.axis["xzero"].set_visible(True)
    axis.axis['yzero'].set_visible(True)

    """生成坐标箭头"""
    axis.axis["xzero"].set_axisline_style("-|>")
    axis.axis["yzero"].set_axisline_style("-|>")

    axis.axis["top", "right", "left", "bottom"].set_visible(False)  # 隐藏默认坐标轴
    axis.grid(True, linestyle='-.')                                 # 设置网格样式

    """设置图形绘制范围"""
    x_boundary = 20  # 图形的边界区间设置为x_boundary 的绝对值
    granularity = 0.01
    x = np.arange(-x_boundary, x_boundary, granularity)
    a, b, c = list(map(float, d.split(' ')))    # 输入a、b、c的值
    y = a * pow(x, 2) + b * x + c  # 计算y的值
    axis.plot(x, y)
    # 添加标题
    plt.title('y  =  ax^2  +  bx  +  c\na={:.2f}, b={:.2f}, c={:.2f}'.format(a, b, c),
              bbox=dict(facecolor='g', edgecolor='blue', alpha=0.65), fontsize='20')

    """根据a、b、c的值画图"""
    if a == 0: # 如果a == 0, 画一条y = bx + c的线, 并提示a不要为0
        plt.text(0, 0, r'$this\ is\ a\ line\ !!!$', fontdict={'size': '20', 'color': 'red'})
        plt.text(0, -1, r'$please\ make\ sure\ the\ first\ number\ is\ not\ 0!!!$', fontdict={'size': '20', 'color': 'red'})
        # 如果a == 0,则没有极值, 坐标轴默认大小
        extremum_x = 0
        extremum_y = 0
    else:
        # 计算极值点
        extremum_x = - (b / (2 * a))
        extremum_y = (4 * a * c - pow(b, 2)) / (4 * a)
        # 标注极值点
        plt.scatter(extremum_x, extremum_y)
        # 根据a的符号更新描述信息
        if a > 0:
            point_describe = "小"
        else:
            point_describe = "大"
        # 距离极值点1个单位打印极值点描述
        plt.text(extremum_x, extremum_y - (a / a.__abs__()),
                 '(%.2f, %.2f)是极%s值点' % (extremum_x, extremum_y, point_describe),
                 fontdict={'size': '18', 'color': 'b'})
        # 如果等于0的解存在, 则求根
        delta = pow(b, 2) - 4 * a * c
        if delta < 0:  # 没有实根
            # 距离极值点1个单位打印无实根
            plt.text(extremum_x, extremum_y - 2 * (a / a.__abs__()),
                     '此方程没有实根',
                     fontdict={'size': '18', 'color': 'red'})
        elif delta == 0:  # 有重根
            x1 = (-b + math.sqrt(delta)) / (2 * a)
            # 标注y = 0的点
            plt.scatter(x1, 0)
            # 距离实根1个单位打印坐标
            plt.text(x1, 0 + 1 * (a / a.__abs__()),
                     '(%.2f, 0)是唯一实根' % x1,
                     fontdict={'size': '18', 'color': '#0cf'})
        else:  # 有两个实根
            x1 = (-b + math.sqrt(delta)) / (2 * a)
            x2 = (-b - math.sqrt(delta)) / (2 * a)
            # 标注y = 0的点
            plt.scatter(x1, 0)
            plt.scatter(x2, 0)
            # 距离实根1个单位打印第1个根的坐标
            plt.text(x1, 0 - 1 * (a / a.__abs__()),
                     '(%.2f, 0)是第一个根' % x1,
                     fontdict={'size': '18', 'color': '#000'})
            # 距离实根1个单位打印第2个根的坐标
            plt.text(x2, 0 + 1 * (a / a.__abs__()),
                     '(%.2f, 0)是第二个根' % x2,
                     fontdict={'size': '18', 'color': '#000'})

    """根据极值点动态调整坐标轴范围"""
    axis.set_xlim([extremum_x - 10, extremum_x + 10])
    axis.set_ylim([-extremum_y.__abs__() - 10, extremum_y.__abs__() + 10])
    plt.text(extremum_x + 10, 0.5, 'x', fontdict={'size': '18', 'color': '#000'})
    plt.text(0.5, extremum_y.__abs__() + 9.2, 'y', fontdict={'size': '18', 'color': '#000'})

    """显示图片"""
    plt.show()

def control_entry():
    #获取输入值
    d = entry_parabola.get()
    #调用函数
    parabola(d)


if __name__ == '__main__':
    # 初始化
    root = tk.Tk()
    # 图形界面的标题
    root.title('一元函数画图')
    # 窗口的尺寸,分别对应的宽和高
    root.geometry('250x100')
    # 文本提示
    label_parabola = tk.Label(root, text='y=ax^2+bx+c,请输入a,b,c的值,用空格隔开')
    # 随机数展示的entry
    entry_parabola = tk.Entry(root)
    # 生成随机数的按钮,按下按钮触发函数
    #执行标签代码
    label_parabola.pack()
    #执行输入框代码
    entry_parabola.pack()

    button_gen = tk.Button(
    root,
    text='点击按钮',
    command=control_entry)

    #执行按钮代码
    button_gen.pack()

    # 保持图形界面不被销毁
    root.mainloop()
三、制作软件
直接百度:python打包 即可。
打包完成后,后缀为exe文件,如图:

四、总结
如此就可以制作一个简单的python软件。界面做的更美观些,多添加几个函数,就可以做成我的博客中的基本函数画图软件。


