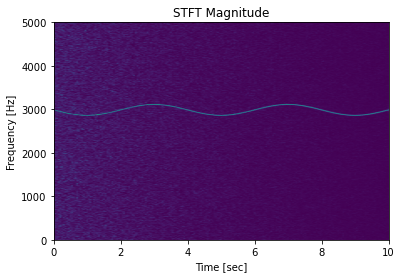
from scipy import signal
import matplotlib.pyplot as plt
rng = np.random.default_rng()

fs = 10e3
N = 1e5
amp = 2 * np.sqrt(2)
noise_power = 0.01 * fs / 2
time = np.arange(N) / float(fs)
mod = 500*np.cos(2*np.pi*0.25*time)
carrier = amp * np.sin(2*np.pi*3e3*time + mod)
noise = rng.normal(scale=np.sqrt(noise_power),
                   size=time.shape)
noise *= np.exp(-time/5)
x = carrier + noise

f, t, Zxx = signal.stft(x, fs, nperseg=1000)
plt.pcolormesh(t, f, np.abs(Zxx), vmin=0, vmax=amp, shading='gouraud')
plt.title('STFT Magnitude')
plt.ylabel('Frequency [Hz]')
plt.xlabel('Time [sec]')
plt.show()

Ref: https://docs.scipy.org/doc/scipy/reference/generated/scipy.signal.stft.html