# readexcel.py
# 读取一个excel文档

def read(filename: str):
    import xlrd
    # 打开一个Excel文件
    data = xlrd.open_workbook(filename)
    # 打开第一个工作表
    table = data.sheets()[0]
    # 遍历各行
    the_excel = []
    for i in range(table.nrows):
        the_excel.append(table.row_values(i))

    return the_excel

————————————————
版权声明:本文为CSDN博主「Ng Wing Kei」的原创文章,遵循CC 4.0 BY-SA版权协议,转载请附上原文出处链接及本声明。
原文链接:https://blog.csdn.net/weixin_42237817/article/details/120856790
import readexcel
import numpy as np
import matplotlib.pyplot as plt
import random
data = readexcel.read('MyExcel.xlsx')
def linear_plot():
SumXiYi = 0
SumXi = 0
SumYi = 0
SumXi2 = 0
data_1 = list()
for item in range(len(data)):
a_note = list()
for i in range(3):
a_note.append([data[item][i*2], data[item][i*2+1]])
data_1.append(a_note)
for i in range(3):
PointX = []
PointY = []
SumXiYi = 0
SumXi = 0
SumYi = 0
SumXi2 = 0
for item in range(len(data_1)):
PointX.append(data_1[item][i][0])
PointY.append(data_1[item][i][1])
XiYi = PointX[item] * PointY[item]
SumXiYi += XiYi
SumXi += PointX[item]
SumYi += PointY[item]
SumXi2 += PointX[item]**2
w = (len(data) * SumXiYi - SumXi * SumYi) / (len(data_1) * SumXi2 - SumXi * SumXi)
b = (SumXi2 * SumYi - SumXiYi * SumXi) / (len(data) * SumXi2 - SumXi * SumXi)
X = np.arange(min(PointX) - 1, max(PointX) + 2)
Y = w * X + b
plt.plot(X, Y, color=['green','red','blue'][i])
# plt.scatter(PointX, PointY, color=['green','red','blue'][i]) # 散点图
plt.text(max(PointX), w * max(PointX) + b, f'{2015+2*i}',color=['green','red','blue'][i])
for item in range(len(data_1)):
PointX = []
PointY = []
col = (random.randint(0, 255) / 255, random.randint(0, 255) / 255, random.randint(0, 255) / 255)
for i in range(3):
PointX.append(data_1[item][i][0])
PointY.append(data_1[item][i][1])
X = [PointX[0], PointX[1]]
Y = [PointY[0], PointY[1]]
plt.plot(X, Y, color=col)
X = [PointX[1], PointX[2]]
Y = [PointY[1], PointY[2]]
plt.plot(X, Y, color=col)
plt.scatter(PointX[0], PointY[0], marker=10, color=col) # 散点图
plt.scatter(PointX[1:3], PointY[1:3], color=col)
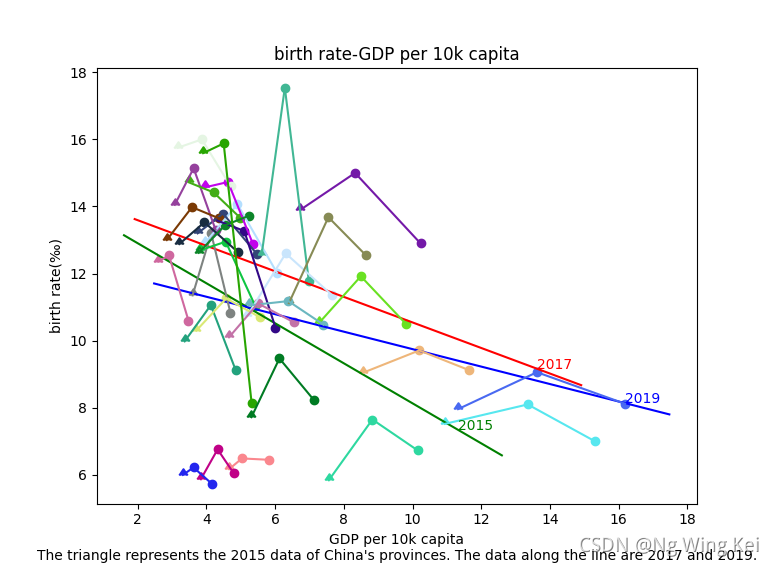
plt.title("birth rate-GDP per 10k capita")
plt.xlabel("GDP per 10k capita\nThe triangle represents the 2015 data of China's provinces. The data along the line are 2017 and 2019.")
plt.ylabel("birth rate(‰)")
# plt.text(max(PointX)/2, w * max(PointX) + b, f'y={w:.2f}*X+{b:.2f}')
plt.show()
return w, b
linear_plot()数据:
第0、1列是2015年的数据,2、3列是2017年的数据,4、5列是2019年的数据;
第0、2、4列是人均GDP(亿元/万人),第1、3、5为出生率(‰)?;
| 11.325 | 7.96 | 13.62032817 | 9.06 | 16.18497717 | 8.12 |
| 7.560458652 | 5.84 | 8.830212766 | 7.65 | 10.14837545 | 6.73 |
| 3.594063989 | 11.35 | 4.135618842 | 13.2 | 4.697005506 | 10.83 |
| 3.363569196 | 9.98 | 4.126581197 | 11.06 | 4.850328853 | 9.12 |
| 5.306967213 | 7.72 | 6.123345664 | 9.47 | 7.127329193 | 8.23 |
| 4.65889811 | 6.17 | 5.030844156 | 6.49 | 5.811386486 | 6.45 |
| 3.833907386 | 5.87 | 4.323832146 | 6.76 | 4.790359477 | 6.05 |
| 3.312553131 | 6 | 3.62253604 | 6.22 | 4.161105991 | 5.73 |
| 10.93856794 | 7.52 | 13.35158151 | 8.1 | 15.31140669 | 7 |
| 8.569561034 | 9.05 | 10.19468123 | 9.71 | 11.64916755 | 9.12 |
| 7.269456976 | 10.52 | 8.493209076 | 11.92 | 9.797960784 | 10.51 |
| 3.964598237 | 12.92 | 4.899488195 | 14.07 | 6.048177938 | 12.03 |
| 6.731802209 | 13.9 | 8.325313653 | 15 | 10.23123036 | 12.9 |
| 3.741560758 | 13.2 | 4.480336954 | 13.79 | 5.462201063 | 12.59 |
| 5.603973241 | 12.55 | 6.280484401 | 17.54 | 6.98006135 | 11.77 |
| 3.822708999 | 12.7 | 4.560474107 | 12.95 | 5.425492375 | 11.02 |
| 5.187008547 | 10.74 | 6.306741192 | 12.6 | 7.664754513 | 11.35 |
| 4.314225246 | 13.58 | 5.099969848 | 13.27 | 6.00814759 | 10.39 |
| 6.399417709 | 11.12 | 7.548694506 | 13.68 | 8.646560974 | 12.54 |
| 3.075826232 | 14.05 | 3.625575708 | 15.14 | 4.262765957 | 13.31 |
| 3.951534392 | 14.57 | 4.627057613 | 14.73 | 5.35758794 | 12.87 |
| 5.224918567 | 11.05 | 6.382410941 | 11.18 | 7.404579674 | 10.48 |
| 3.70204978 | 10.3 | 4.572940041 | 11.26 | 5.551886002 | 10.7 |
| 2.842772384 | 13 | 3.577544044 | 13.98 | 4.357926195 | 13.65 |
| 3.208235042 | 12.88 | 3.939058172 | 13.53 | 4.926559185 | 12.63 |
| 3.160606061 | 15.75 | 3.865329513 | 16 | 4.703047091 | 14.6 |
| 4.653874155 | 10.1 | 5.500384221 | 11.11 | 6.539858012 | 10.55 |
| 2.598731669 | 12.36 | 2.909080095 | 12.54 | 3.474810682 | 10.6 |
| 3.485268631 | 14.72 | 4.20665529 | 14.42 | 4.984915254 | 13.66 |
| 3.771052632 | 12.62 | 4.539432624 | 13.44 | 5.228033473 | 13.72 |
| 3.902264151 | 15.59 | 4.499959677 | 15.88 | 5.313442751 | 8.14 |
结果:


?
?
?
?