numpy学习
什么是numpy
一个在Python中做科学计算的基础库,重在数值计算,也是大部分PYTHON科学计算库的基础库,多用于在大型、多维数组上执行数值运算。
numpy创建数组(矩阵)
import numpy as np

#使用numpy生成数组,得到ndarray的类型
t1 = np.array([1,2,3])
print(t1)
print(type(t1))

t2 = np.array(range(10))
print(t2)
print(type(t2))

t3 = np.arange(4,10,2) # arange()等价于array(range())
print(t3)
print(type(t3))
print(t3.dtype)
运行结果:
[1 2 3]
<class 'numpy.ndarray'>
[0 1 2 3 4 5 6 7 8 9]
<class 'numpy.ndarray'>
[4 6 8]
<class 'numpy.ndarray'>
int32
默认整数类型np.int_是C long,但是C long在win64中是int32.
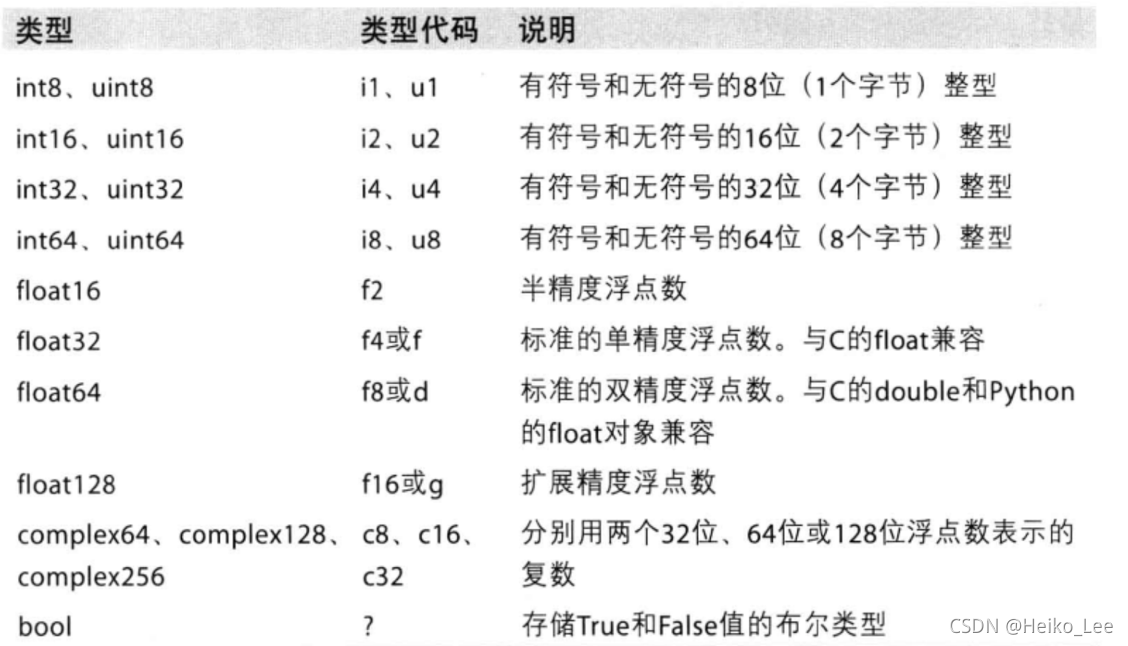
numpy中常见的更多数据类型

数据类型的操作
import numpy as np
import random

#指定创建数组的数据类型
t4 = np.array(range(1,4),dtype=float)
print(t4)
print(t4.dtype)

#numpy中的bool类型
t5 = np.array([1,0,1,1,0],dtype=bool)
print(t5)
print(t5.dtype)

#调整数据类型
t6 = t5.astype("int8")
print(t6)
print(t6.dtype)

#numpy中的小数
t7 = np.array([random.random() for i in range(10)])
print(t7)
print(t7.dtype)
print(np.round(t7,3)) #保留3位小数
运行结果:
[1. 2. 3.]
float64
[ True False  True  True False]
bool
[1 0 1 1 0]
int8
[0.40965587 0.65607682 0.55963194 0.17005824 0.97233548 0.20681428
 0.37630063 0.45185797 0.40072167 0.32030872]
float64
[0.41  0.656 0.56  0.17  0.972 0.207 0.376 0.452 0.401 0.32 ]
数组的形状
查看数组的形状:
import numpy as np

t1 = np.array(range(10))
print(t1)
print(t1.shape) #一维数组
print("#######################################")
t2 = np.array([[0,1,2,3,4],[5,6,7,8,9]])
print(t2)
print(t2.shape) #二维数组
print("#######################################")
t3 = np.array([[[1,2,3],[4,5,6]],[[7,8,9],[10,11,12]]])
print(t3)
print(t3.shape) #三维数组
print("#######################################")
运行结果:
[0 1 2 3 4 5 6 7 8 9]
(10,)
#######################################
[[0 1 2 3 4]
 [5 6 7 8 9]]
(2, 5)
#######################################
[[[ 1  2  3]
  [ 4  5  6]]

 [[ 7  8  9]
  [10 11 12]]]
(2, 2, 3)
#######################################
修改数组的形状:
import numpy as np

t4 = np.array(range(12))
print(t4)
print(t4.reshape((3,4)))
print("#######################################")
t5 = np.arange(24).reshape((2,3,4))
print(t5)
print(t5.reshape((4,6)))
print(t5.flatten()) # 展开成一维数组
运行结果:
[ 0  1  2  3  4  5  6  7  8  9 10 11]
[[ 0  1  2  3]
 [ 4  5  6  7]
 [ 8  9 10 11]]
#######################################
[[[ 0  1  2  3]
  [ 4  5  6  7]
  [ 8  9 10 11]]

 [[12 13 14 15]
  [16 17 18 19]
  [20 21 22 23]]]
[[ 0  1  2  3  4  5]
 [ 6  7  8  9 10 11]
 [12 13 14 15 16 17]
 [18 19 20 21 22 23]]
[ 0  1  2  3  4  5  6  7  8  9 10 11 12 13 14 15 16 17 18 19 20 21 22 23]
数组和数的计算
广播原则

可以把维度指的是shape所对应的数字个数。
shape为(3,3,3)的数组能够和(3,2)的数组进行计算么?
不可以
shape为(3,3,2)的数组能够和(3,2)的数组进行计算么?、
可以
所以假设有两个数组,第一个的维度是(x_1, y_1, z_1),另一个数组的维度是(x_2, y_2, z_2),要判断这两个数组能不能进行计算,可以用如下方法来判断:
if z_1 == z_2 or z_1 == 1 or z_2 == 1:
    if y_1 == y_2 or y_1 == 1 or y_2 == 1:
        if x_1 == x_2 or x_1 == 1 or x_2 == 1:
            可以运算
        else:
            不可以运算
    else:
        不可以运算
else:
    不可以运算
这里需要注意:(3,3,2)和(3,2)是可以运算的,因为对于二维数组(3,2)也可以表示为(1,3,2),套用上述的规则是完全适用的,同理:(4,2,5,4)和(2,1,4)也是可以进行运算的。
轴(axis)
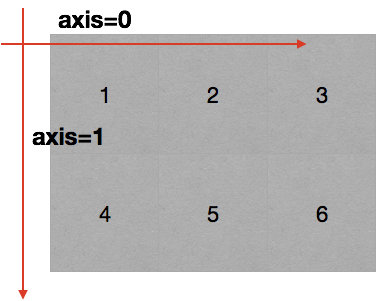
在numpy中可以理解为方向,使用0,1,2…数字表示,对于一个一维数组,只有一个0轴,对于2维数组(shape(2,2)),有0轴和1轴,对于三维数组(shape(2,2, 3)),有0,1,2轴。
有了轴的概念之后,我们计算会更加方便,比如计算一个2维数组的平均值,必须指定是计算哪个方向上面的数字的平均值。
回顾np.arange(0,10).reshape((2,5)),reshpe中2表示0轴长度(包含数据的条数)为2,1轴长度为5,2X5一共10个数据。
二维数组的轴

三维数组的轴

numpy读取本地数据
读取文件:CSV:Comma-Separated Value,逗号分隔值文件
显示:表格状态
源文件:换行和逗号分隔行列的格式化文本,每一行的数据表示一条记录
由于csv便于展示,读取和写入,所以很多地方也是用csv的格式存储和传输中小型的数据,为了方便教学,我们会经常操作csv格式的文件,但是操作数据库中的数据也是很容易的实现的。
np.loadtxt(fname,dtype=np.float,delimiter=None,skiprows=0,usecols=None,unpack=False)

示例:现在这里有一个英国和美国各自youtube1000多个视频的点击,喜欢,不喜欢,评论数量([“views”,“likes”,“dislikes”,“comment_total”])的csv,运用刚刚所学习的只是,我们尝试来对其进行操作。
import numpy as np

us_file_path = "./youtube_video_data/US_video_data_numbers.csv"
uk_file_path = "./youtube_video_data/GB_video_data_numbers.csv"

t1 = np.loadtxt(us_file_path,delimiter=",",dtype="int",unpack=True)
t2 = np.loadtxt(us_file_path,delimiter=",",dtype="int")

print(t1)
print("*"*100)
print(t2)
运行结果:
[[4394029 7860119 5845909 ...  142463 2162240  515000]
 [ 320053  185853  576597 ...    4231   41032   34727]
 [   5931   26679   39774 ...     148    1384     195]
 [  46245       0  170708 ...     279    4737    4722]]
****************************************************************************************************
[[4394029  320053    5931   46245]
 [7860119  185853   26679       0]
 [5845909  576597   39774  170708]
 ...
 [ 142463    4231     148     279]
 [2162240   41032    1384    4737]
 [ 515000   34727     195    4722]]

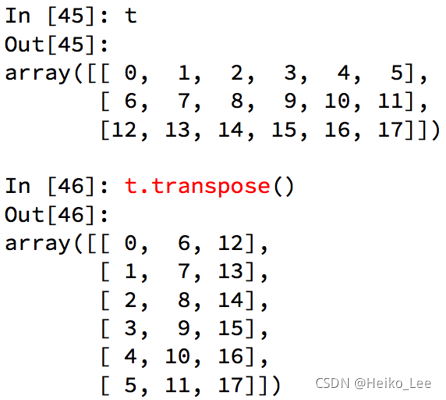
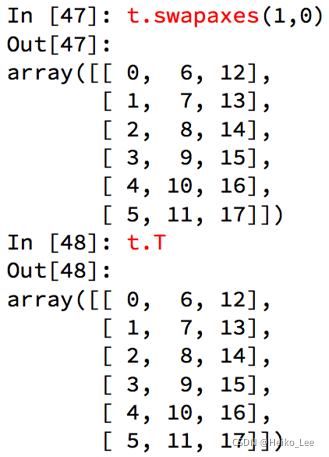
numpy中的转置
常用数组转置:
- self.transpose();
- self.T;
- self.swapaxes(1.0):交换0和1轴。


numpy索引和切片
操作很简单,和python中列表的操作一样。
#取行
print(t2[2]) #第3行
print("*"*100)

#取连续的多行
print(t2[2:]) # 第3行至最后一行
print("*"*100)

#取不连续的多行
print(t2[[2,8,10]]) #第3、9、11行

#加冒号
print(t2[1,:]) #第2行
print(t2[2:,:]) # 第3行至最后一行
print(t2[2:,3]) #第4列的第3行至最后一行
print(t2[2:,:3]) #第3行至最后一行的第1列至第3列
print(t2[[2,8,10],:]) #第3、9、11行

#取列
print(t2[:,0]) #第1列

#取连续的多列
print(t2[:,2:]) #第3列至最后一列
print(t2[:,2::2]) #第3列至最后一列,步长为2

#取不连续的多列
print(t2[:,[0,2]]) #第1列和第三列

#取特定值,取第3行,第4列的值
a = t2[2,3]
print(a)
print(type(a))

# 取多行和多列,取第3行到第5行,第2列到第4列的结果
# 取的是行和列交叉点的位置
b = t2[2:5,1:4] #索引包头不包尾
print(b)

# 取多个不相邻的点
# 选出来的结果是(0,0) (2,1) (2,3)位置的值
c = t2[[0,2,2],[0,1,3]]
print(c)
numpy中数值的修改
import numpy as np
a = np.array([[1,2,3,4],[4,5,6,7],[7,8,9,10],[10,11,12,13]])
print(a)
print("*"*100)
a[:,1:3] = 0
print(a)
print("*"*100)

#布尔索引
print(a==0)
a[a==0] = 1
print(a)
print("*"*100)

#三元运算符
a = np.where(a>5,5,2) #大于5的数变成5,其他的变成3
print(a)
print("*"*100)

#numpy中的clip(裁剪)
a = a.clip(3,4) #比3小的变成3,比4大的变成4
print(a)
运行结果:
[[ 1  2  3  4]
 [ 4  5  6  7]
 [ 7  8  9 10]
 [10 11 12 13]]
****************************************************************************************************
[[ 1  0  0  4]
 [ 4  0  0  7]
 [ 7  0  0 10]
 [10  0  0 13]]
****************************************************************************************************
[[False  True  True False]
 [False  True  True False]
 [False  True  True False]
 [False  True  True False]]
[[ 1  1  1  4]
 [ 4  1  1  7]
 [ 7  1  1 10]
 [10  1  1 13]]
****************************************************************************************************
[[2 2 2 2]
 [2 2 2 5]
 [5 2 2 5]
 [5 2 2 5]]
****************************************************************************************************
[[3 3 3 3]
 [3 3 3 4]
 [4 3 3 4]
 [4 3 3 4]]
numpy中的nan和inf
nan(NAN,Nan):not a number表示不是一个数字。
当我们读取本地的文件为float的时候,如果有缺失,就会出现nan
。当做了一个不合适的计算的时候(比如无穷大(inf)减去无穷大),就会出现nan。
nf(-inf,inf):infinity,inf表示正无穷,-inf表示负无穷
比如一个数字除以0,(python中直接会报错,numpy中是一个inf或者-inf)
nan和inf的type类型都是float型
numpy中的nan的注意点:
- 两个nan是不相等的;
- np.count_nonzero(t!=t),可以统计t中nan的个数,因为t!=t返回bool值,利用布尔索引实现。
- np.isnan(t)与t!=t同;
- nan和任何值计算都是nan
在一组数据中单纯的把nan替换为0,替换之前的平均值如果大于0,替换之后的均值肯定会变小,所以更一般的方式是把缺失的数值替换为均值(中值)或者是直接删除有缺失值的一行
numpy中常用统计函数
- 求和:t.sum(axis=None)
- 均值:t.mean(a,axis=None)
- 受离群点的影响较大
- 中值:np.median(t,axis=None)
- 最大值:t.max(axis=None)
- 最小值:t.min(axis=None)
- 极差:np.ptp(t,axis=None) 即最大值和最小值只差
- 标准差:t.std(axis=None)

标准差是一组数据平均值分散程度的一种度量。一个较大的标准差,代表大部分数值和其平均值之间差异较大;一个较小的标准差,代表这些数值较接近平均值
反映出数据的波动稳定情况,越大表示波动越大,越不稳定。
用数组每列除nan外所有值的平均值代替nan:
import numpy as np

def fill_ndarray(t1):
    for i in range(t1.shape[1]):  #遍历每一列
        temp_col = t1[:,i]  #当前的一列
        nan_num = np.count_nonzero(temp_col!=temp_col)#利用np.count_nonzero统计nan个数
        if nan_num !=0: #不为0,说明当前这一列中有nan
            temp_not_nan_col = temp_col[temp_col==temp_col] #当前一列不为nan的array

            # 选中当前为nan的位置,把值赋值为当前列不为nan的均值
            temp_col[np.isnan(temp_col)] = temp_not_nan_col.mean()
    return t1

if __name__ == '__main__':
    t1 = np.arange(24).reshape((4, 6)).astype("float")
    t1[1, 2:] = np.nan
    print(t1)
	print("*"*100)
    t1 = fill_ndarray(t1)
    print(t1)
运行结果:
[[ 0.  1.  2.  3.  4.  5.]
 [ 6.  7. nan nan nan nan]
 [12. 13. 14. 15. 16. 17.]
 [18. 19. 20. 21. 22. 23.]]
****************************************************************************************************
[[ 0.  1.  2.  3.  4.  5.]
 [ 6.  7. 12. 13. 14. 15.]
 [12. 13. 14. 15. 16. 17.]
 [18. 19. 20. 21. 22. 23.]]
结合matplotlib把数据呈现出来
1.英国和美国各自youtube1000的数据结合之前的matplotlib绘制出各自的评论数量的直方图
import numpy as np
from matplotlib import  pyplot as plt

us_file_path = "./youtube_video_data/US_video_data_numbers.csv"
uk_file_path = "./youtube_video_data/GB_video_data_numbers.csv"

# t1 = np.loadtxt(us_file_path,delimiter=",",dtype="int",unpack=True)
t_us = np.loadtxt(us_file_path,delimiter=",",dtype="int")

#取评论的数据
t_us_comments = t_us[:,-1]

#选择比5000小的数据
t_us_comments = t_us_comments[t_us_comments<=5000]

print(t_us_comments.max(),t_us_comments.min())

d = 50

bin_nums = (t_us_comments.max()-t_us_comments.min())//d

#绘图
plt.figure(figsize=(20,8),dpi=80)

plt.hist(t_us_comments,bin_nums)


plt.show()
运行结果:
4995 0

2.希望了解英国的youtube中视频的评论数和喜欢数的关系,应该如何绘制改图
import numpy as np
from matplotlib import  pyplot as plt

us_file_path = "./youtube_video_data/US_video_data_numbers.csv"
uk_file_path = "./youtube_video_data/GB_video_data_numbers.csv"

# t1 = np.loadtxt(us_file_path,delimiter=",",dtype="int",unpack=True)
t_uk = np.loadtxt(uk_file_path,delimiter=",",dtype="int")

#选择喜欢书比50万小的数据
t_uk = t_uk[t_uk[:,1]<=500000]

t_uk_comment = t_uk[:,-1]
t_uk_like = t_uk[:,1]


plt.figure(figsize=(20,8),dpi=80)
plt.scatter(t_uk_like,t_uk_comment)

plt.show()
运行结果:
